Join IoT Central | Join our LinkedIn Group | Post on IoT Central


Software (117)

Well, this isn’t something I expected to be talking about today, but my chum Ben Cook just introduced me to something that looks rather cool.

Ben is the Founder and Director at Airspeed Electronics Ltd., which is an electronic design consultancy that’s based in the UK specializing in high-performance acoustic detection and tracking technology for counter-unmanned aircraft system (UAS) applications. The folks at Airspeed Electronics are currently developing a drone detection and tracking system called MANTIS, where this work is being funded through a research grant provided by the UK Ministry of Defence (which — before you make a nasty comment — is how they spell “Defense” in the UK).

MANTIS, which stands for “MAchine learNing acousTIc Surveillance,” is a system of distributed, intelligent acoustic sensors that use artificial intelligence (AI) for the detection, classification, and location estimation of UAS — such as drones — based on their acoustic signatures.

But that’s not what I wanted to talk to you about…

In his email to me, Ben spake as follows: “Have you heard of an embedded operating system called ‘Luos’ before? It’s a microservices software architecture, like docker but for use with microcontrollers. I have no affiliation, I just stumbled across this today and I’m thinking this could be very useful for some future projects. It looks really good for anything ‘modular-y,’ if you know what I mean…”

I do know what Ben means. I just meandered my way around the luos.io website, perused and pondered the documentation at docs.luos.io, and watched this video on YouTube (later today, I’m going to get the tattoo, buy the T-shirt, and see the stage play).

In a nutshell, Luos is a simple and lightweight open-source distributed operating system dedicated to embedded systems. It uses the concept of modularity to simplify the linking of components and chunks of application code together to form a single system image.

Consider a system like a robot that uses multiple microcontrollers to manage its various sensors, actuators, and motors. If each of these microcontrollers employs Luos technology, all of them can use any feature of any microcontroller in the system as if all of the features were located in the same component.

Now, I’m a hardware design engineer by trade, so the software side is a bit outside my bailiwick, but — even so — looking at the video above and scanning the documentation makes me sit up and say, “Wow, this looks really, really cool.”

I asked around a few of my embedded systems software developer friends, and no one had heard of Luos, but I have a feeling that this may be a tool that’s poised to make a big splash. All sorts of ideas are currently bouncing around my head, like the fact that the Tracealyzer tool from Percepio would make an ideal companion for the Luos OS (see also The 2021 Embedded Online Conference Approacheth).

How about you? Have you heard of Luos? If so, what are your thoughts? If not, and if you lean toward the software side of things, it would be great if you could take a look with your highly trained eye, see what you think, and report back to the rest of us in the comments below.

Originally posted HERE

Read more…

The world has seen the emergence of countless advanced technologies over the past few decades and among them, one of the most notable and impactful has been the Internet of Things. Often described as a critical part of the foundation of our technology-driven future, IoT has shaken up pretty much every industry on the face of Earth. For the better, of course. Anyway, this transformation brought on by IoT has made its way into the world of web and mobile apps development too, and understandably so. After all, today apps are not only the most omnipresent modern tools but are relied upon by millions and millions of people every single day. Suffice it to say that app development is vital to the cause of keeping the world running and IoT has only entered the scene to further improve things. But the question remains: How?

The Internet of Things is a dynamic technology that has, for starters, completely changed how users in the digital realm interact and engage with web applications as well as mobile applications. It not only enables companies to effortlessly deal with humongous volumes of data, but also ensures top-notch security, seamless communications, and so much more. After all, the Internet of Things market is not projected to touch $11 trillion in economic value by 2025 without reason. Studies have also found that the global investment in IoT could touch $15 trillion by 2025. Now, let’s explore some of its other contributions to app development in detail.

1. Smarter UIs: While it can be quite challenging to put together UIs that integrate modern technologies and still successfully tend to users’ expectations, IoT can help considerably in this regard. It is highly conducive to the development of effective UI and integrates relevant latest trends to further enhance users’ experiences while engaging with the app. Oh, and let’s not forget that it also enables A/B split tests to help developers identify which iteration of the app is best suited for success.
2. Cybersecurity: Of course, ensuring high levels of security with your apps is a top priority for everyone. IoT helps ameliorate this process by helping programmers to integrate the latest security measures and strategies. This includes modern identification and authorization methods to monitor the continued safety of all the data stored within the app.
3. Chatbots: Now, artificial intelligence and machine learning-driven chatbots can be further integrated with the Internet of Things to empower them with access to even more sources of data. This, then, allows them to answer customers' queries and issues in a much more proficient manner, which is critical to ensuring high levels of customer satisfaction in an increasingly competitive market.
4. Data collection and processing: Data collection and its processing are critical to the success of any app in the world today. With the Internet of Things, that ability is fortified since one now gains access to a wider set of sources for data. Furthermore, IoT also helps avoid any lags in the relay of this information, thus enabling it to be used in real-time.

There is not even a shred of doubt that avant-garde technologies such as the Internet of Things, artificial intelligence, machine learning, etc. have completely transformed the web and mobile app development process and for good! So, if you want to take advantage of IoT and other such technologies to build modern apps that are more secure, highly customer experience-focused, and enable the seamless collection of data among other things, all you have to do is find a qualified service provider for their development. Their expertise and knowledge will further fortify your product and thus, your customers’ experiences.

Read more…

By Sachin Kotasthane

In his book, 21 Lessons for the 21st Century, the historian Yuval Noah Harari highlights the complex challenges mankind will face on account of technological challenges intertwined with issues such as nationalism, religion, culture, and calamities. In the current industrial world hit by a worldwide pandemic, we see this complexity translate in technology, systems, organizations, and at the workplace.

While in my previous article, Humane IIoT, I discussed the people-centric strategies that enterprises need to adopt while onboarding IoT initiatives of industrial IoT in the workforce, in this article, I will share thoughts on how new-age technologies such as AI, ML, and big data, and of course, industrial IoT, can be used for effective management of complex workforce problems in a factory, thereby changing the way people work and interact, especially in this COVID-stricken world.

Workforce related problems in production can be categorized into:

  1. Time complexity
  2. Effort complexity
  3. Behavioral complexity

Problems categorized in either of the above have a significant impact on the workforce, resulting in a detrimental effect on the outcome—of the product or the organization. The complexity of these problems can be attributed to the fact that the workforce solutions to such issues cannot be found using just engineering or technology fixes as there is no single root-cause, rather, a combination of factors and scenarios. Let us, therefore, explore a few and seek probable workforce solutions.8829066088?profile=RESIZE_584x

Figure 1: Workforce Challenges and Proposed Strategies in Production

  1. Addressing Time Complexity

    Any workforce-related issue that has a detrimental effect on the operational time, due to contributing factors from different factory systems and processes, can be classified as a time complex problem.

    Though classical paper-based schedules, lists, and punch sheets have largely been replaced with IT-systems such as MES, APS, and SRM, the increasing demands for flexibility in manufacturing operations and trends such as batch-size-one, warrant the need for new methodologies to solve these complex problems.

    • Worker attendance

      Anyone who has experienced, at close quarters, a typical day in the life of a factory supervisor, will be conversant with the anxiety that comes just before the start of a production shift. Not knowing who will report absent, until just before the shift starts, is one complex issue every line manager would want to get addressed. While planned absenteeism can be handled to some degree, it is the last-minute sick or emergency-pager text messages, or the transport delays, that make the planning of daily production complex.

      What if there were a solution to get the count that is almost close to the confirmed hands for the shift, an hour or half, at the least, in advance? It turns out that organizations are experimenting with a combination of GPS, RFID, and employee tracking that interacts with resource planning systems, trying to automate the shift planning activity.

      While some legal and privacy issues still need to be addressed, it would not be long before we see people being assigned to workplaces, even before they enter the factory floor.

      During this course of time, while making sure every line manager has accurate information about the confirmed hands for the shift, it is also equally important that health and well-being of employees is monitored during this pandemic time. Use of technologies such as radar, millimeter wave sensors, etc., would ensure the live tracking of workers around the shop-floor and make sure that social distancing norms are well-observed.

    • Resource mapping

      While resource skill-mapping and certification are mostly HR function prerogatives, not having the right resource at the workstation during exigencies such as absenteeism or extra workload is a complex problem. Precious time is lost in locating such resources, or worst still, millions spent in overtime.

      What if there were a tool that analyzed the current workload for a resource with the identified skillset code(s) and gave an accurate estimate of the resource’s availability? This could further be used by shop managers to plan manpower for a shift, keeping them as lean as possible.

      Today, IT teams of OEMs are seen working with software vendors to build such analytical tools that consume data from disparate systems—such as production work orders from MES and swiping details from time systems—to create real-time job profiles. These results are fed to the HR systems to give managers the insights needed to make resource decisions within minutes.

  2. Addressing Effort Complexity

    Just as time complexities result in increased  production time, problems in this category result in an increase in effort by the workforce to complete the same quantity of work. As the effort required is proportionate to the fatigue and long-term well-being of the workforce, seeking workforce solutions to reduce effort would be appreciated. Complexity arises when organizations try to create a method out-of-madness from a variety of factors such as changing workforce profiles, production sequences, logistical and process constraints, and demand fluctuations.

    Thankfully, solutions for this category of problems can be found in new technologies that augment existing systems to get insights and predictions, the results of which can reduce the efforts, thereby channelizing it more productively. Add to this, the demand fluctuations in the current pandemic, having a real-time operational visibility, coupled with advanced analytics, will ensure meeting shift production targets.

    • Intelligent exoskeletons

      Exoskeletons, as we know, are powered bodysuits designed to safeguard and support the user in performing tasks, while increasing overall human efficiency to do the respective tasks. These are deployed in strain-inducing postures or to lift objects that would otherwise be tiring after a few repetitions. Exoskeletons are the new-age answer to reducing user fatigue in areas requiring human skill and dexterity, which otherwise would require a complex robot and cost a bomb.

      However, the complexity that mars exoskeleton users is making the same suit adaptable for a variety of postures, user body types, and jobs at the same workstation. It would help if the exoskeleton could sense the user, set the posture, and adapt itself to the next operation automatically.

      Taking a leaf out of Marvel’s Iron Man, who uses a suit that complements his posture that is controlled by JARVIS, manufacturers can now hope to create intelligent exoskeletons that are always connected to factory systems and user profiles. These suits will adapt and respond to assistive needs, without the need for any intervention, thereby freeing its user to work and focus completely on the main job at hand.

      Given the ongoing COVID situation, it would make the life of workers and the management safe if these suits are equipped with sensors and technologies such as radar/millimeter wave to help observe social distancing, body-temperature measuring, etc.

    • Highlighting likely deviations

      The world over, quality teams on factory floors work with checklists that the quality inspector verifies for every product that comes at the inspection station. While this repetitive task is best suited for robots, when humans execute such repetitive tasks, especially those that involve using visual, audio, touch, and olfactory senses, mistakes and misses are bound to occur. This results in costly reworks and recalls.

      Manufacturers have tried to address this complexity by carrying out rotation of manpower. But this, too, has met with limited success, given the available manpower and ever-increasing workloads.

      Fortunately, predictive quality integrated with feed-forwards techniques and some smart tracking with visuals can be used to highlight the area or zone on the product that is prone to quality slips based on data captured from previous operations. The inspector can then be guided to pay more attention to these areas in the checklist.

  3. Addressing Behavioral Complexity

    Problems of this category usually manifest as a quality issue, but the root cause can often be traced to the workforce behavior or profile. Traditionally, organizations have addressed such problems through experienced supervisors, who as people managers were expected to read these signs, anticipate and align the manpower.

    However, with constantly changing manpower and product variants, these are now complex new-age problems requiring new-age solutions.

    • Heat-mapping workload

      Time and motion studies at the workplace map the user movements around the machine with the time each activity takes for completion, matching the available cycle-time, either by work distribution or by increasing the manpower at that station. Time-consuming and cumbersome as it is, the complexity increases when workload balancing is to be done for teams working on a single product at the workstation. Movements of multiple resources during different sequences are difficult to track, and the different users cannot be expected to follow the same footsteps every time.

      Solving this issue needs a solution that will monitor human motion unobtrusively, link those to the product work content at the workstation, generate recommendations to balance the workload and even out the ‘congestion.’ New industrial applications such as short-range radar and visual feeds can be used to create heat maps of the workforce as they work on the product. This can be superimposed on the digital twin of the process to identify the zone where there is ‘congestion.’ This can be fed to the line-planning function to implement corrective measures such as work distribution or partial outsourcing of the operation.

    • Aging workforce (loss of tribal knowledge)

      With new technology coming to the shop-floor, skills of the current workforce get outdated quickly. Also, with any new hire comes the critical task of training and knowledge sharing from experienced hands. As organizations already face a shortage of manpower, releasing more hands to impart training to a larger workforce audience, possibly at different locations, becomes an even more daunting task.

      Fully realizing the difficulties and reluctance to document, organizations are increasingly adopting AR-based workforce trainings that map to relevant learning and memory needs. These AR solutions capture the minutest of the actions executed by the expert on the shop-floor and can be played back by the novice in-situ as a step-by-step guide. Such tools simplify the knowledge transfer process and also increase worker productivity while reducing costs.

      Further, in extraordinary situations such  as the one we face at present, technologies such as AR offer solutions for effective and personalized support to field personnel, without the need to fly in specialists at multiple sites. This helps keep them safe, and accessible, still.

Key takeaways and Actionable Insights

The shape of the future workforce will be the result of complex, changing, and competing forces. Technology, globalization, demographics, social values, and the changing personal expectations of the workforce will continue to transform and disrupt the way businesses operate, increasing the complexity and radically changing where, and when of future workforce, and how work is done. While the need to constantly reskill and upskill the workforce will be humongous, using new-age techniques and technologies to enhance the effectiveness and efficiency of the existing workforce will come to the spotlight.

8829067296?profile=RESIZE_710x

Figure 2: The Future IIoT Workforce

Organizations will increasingly be required to:

  1. Deploy data farming to dive deep and extract vast amounts of information and process insights embedded in production systems. Tapping into large reservoirs of ‘tribal knowledge’ and digitizing it for ingestion to data lakes is another task that organizations will have to consider.
  2. Augment existing operations systems such as SCADA, DCS, MES, CMMS with new technology digital platforms, AI, AR/VR, big data, and machine learning to underpin and grow the world of work. While there will be no dearth of resources in one or more of the new technologies, organizations will need to ‘acqui-hire’ talent and intellectual property using a specialist, to integrate with existing systems and gain meaningful actionable insights.
  3. Address privacy and data security concerns of the workforce, through the smart use of technologies such as radar and video feeds.

Nonetheless, digital enablement will need to be optimally used to tackle the new normal that the COVID pandemic has set forth in manufacturing—fluctuating demands, modular and flexible assembly lines, reduced workforce, etc.

Originally posted here.

Read more…

Image Source: SEGGER.com

Nearly every embedded software developer working in the IoT space is now building secure devices. Developers have been mostly focused on how to handle secure applications and the basic microcontroller technologies such as how to use Arms TrustZone or leverage multicore processors. A looming problem that many companies and teams are overlooking is that figuring out how to develop secure applications is just the first step. There are three stages to secure product lifecycle management and in today’s post, we will review what is involved in each stage.

As a quick overview, the stages, which can be seen in the diagram below, are:

  • Development
  • Test and Production Deployment
  • Maintenance and In-field Servicing

Let us look at each of these stages in a little more detail. 

Stage #1 – Development

Development is probably the area that most developers are the most familiar with, but at the same time, the area that they are learning to adapt to the most. Many developers have designed and built systems without ever having to take security into account. Development involves a lot more than just deciding which components to isolate and how to separate the software into secure and non-secure regions.

For example, during the development phase developers now need to learn how to develop in the environment where a secure bootloader is in place. They need to consider how to handle firmware fallbacks, if they are allowed and if so, under what conditions. Firmware images may need to be compressed on top of the need for authentication.

While the development stage has become more complicated, developers should not struggle too much to extrapolate their past experiences to developing secure firmware successfully.

Stage #2 – Test and Production Deployment

The area that developers will probably struggle with the most is the test and production deployment stage. Testing secure software requires additional steps to be taken that authenticate debug hardware so that the developer can access secure memory regions to test their code and successfully debug it. Even more importantly, care must be taken to install that secure software onto a product during production.

There are several ways this can be done, but one method is to use a secure flashing device like SEGGERS Flasher Secure. These devices can follow a multistep process that involves validating a user ID which allows the secure firmware to be installed on the device. The devices themselves limit how many and on what devices the firmware can be installed which helps to protect a team’s intellectual property and prevents unauthorized production of a product.

8782955684?profile=RESIZE_710x

Stage #3 – Maintenance and In-field Servicing

Finally, there is the maintenance and in-field servicing stage which is a partial continuation of the development phase. Once a product has been deployed into the field, it needs to be securely updated. Updates can be done manually in-field, or they can be done using an over-the-air update process. This involves a device being able to contact a secure firmware server that can compress and encrypt the image and transport it to the device. Once the device has received the image, it must decrypt, decompress and validate the contents of the image. If everything looks good, the image can then be loaded as the primary firmware for the device.

Conclusions

 There is much more to designing and deploying a secure device than simply developing a secure application. The entire process is broken up into three main stages that we have looked at in greater detail today. Unfortunately, we have only just scratched the surface!

Orignally posted here.

Read more…

In this blog, we’ll discuss how users of Edge Impulse and Nordic can actuate and stream classification results over BLE using Nordic’s UART Service (NUS). This makes it easy to integrate embedded machine learning into your next generation IoT applications. Seamless integration with nRF Cloud is also possible since nRF Cloud has native support for a BLE terminal. 

We’ve extended the Edge Impulse example functionality already available for the nRF52840 DK and nRF5340 DK by adding the abilities to actuate and stream classification outputs. The extended example is available for download on github, and offers a uniform experience on both hardware platforms. 

Using nRF Toolbox 

After following the instructions in the example’s readme, download the nRF Toolbox mobile application (available on both iOS and Android) and connect to the nRF52840 DK or the nRF5340 DK that will be discovered as “Edge Impulse”. Once connected, set up the interface as follows so that you can get information about the device, available sensors, and start/stop the inferencing process. Save the preset configuration so that you can load it again for future use. Fill out the text of the various commands to use the same convention as what is used for the Edge Impulse AT command set. For example, sending AT+RUNIMPULSE starts the inferencing process on the device. 

IMG_7478_474aa59323.jpg
Figure 1. Setting up the Edge Impulse AT Command set

Once the appropriate AT command set mapping to an icon has been done, hit the appropriate icon. Hitting the ‘play’ button cause the device to start acquiring data and perform inference every couple of seconds. The results can be viewed in the “Logs” menu as shown below.

NUS_ble_logger_view_e9daba3698.jpg
Figure 2. Classification Output over BLE in the Logs View

Using nRF Cloud

Using the nRF Connect for Cloud mobile app for iOS and Android, you can turn your smartphone into a BLE gateway. This allows users to easily connect their BLE NUS devices running Edge Impulse to the nRF Cloud as an easy way to send the inferencing conclusions to the cloud. It’s as easy as setting up the BLE gateway through the app, connecting to the “Edge Impulse” device and watching the same results being displayed in the “Terminal over BLE” window shown below!

Screen_Hunter_229_Feb_16_23_45_26c8913865.jpg
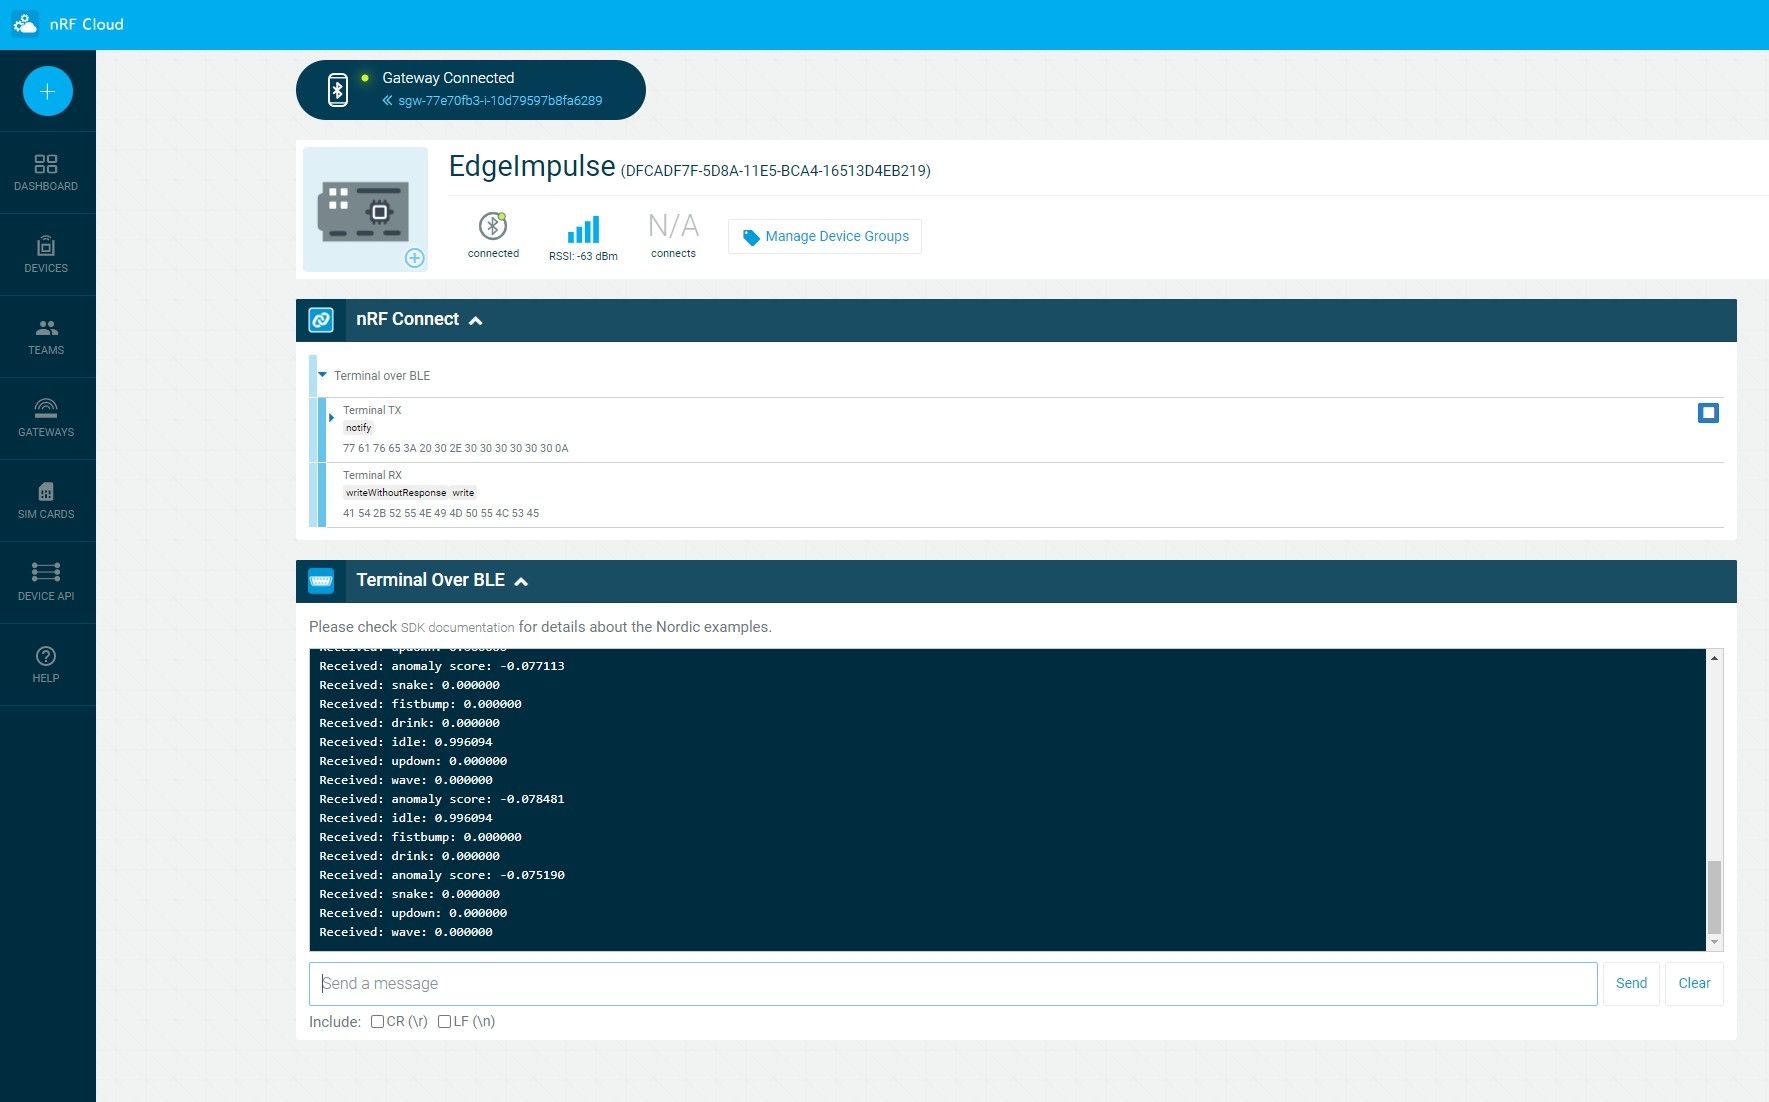
Figure 3. Classification Output Shown in nRF Cloud

Summary

Edge Impulse is supercharging IoT with embedded machine learning and we’ve discussed a couple of ways you can easily send conclusions to either the smartphone or to the cloud by leveraging the Nordic UART Service. We look forward to seeing how you’ll leverage Edge Impulse, Nordic and BLE to create your next gen IoT application.  


Article originally written for the Edge Impulse blog by Zin Thein Kyaw, Senior User Success Engineer at Edge Impulse.

Read more…

By AKHILESHSINGH SAITHWAR

The LLDP protocol is a Link Layer Discovery Protocol used by network devices to identify their neighbors and their capabilities.

If you want to integrate LLDP protocol in your Linux/Embedded system, there are mainly two open-source codes. The first is lldpd and the other is openlldp. When I needed to integrate the LLDP in my network device, I studied both open-source codes. I am writing this article hoping that it will be useful for others who also want to use LLDP open-source code in their systems or network devices.

Below are the key points which should be considered when selecting the LLDP open-source code.

1. License

License is an important point to consider when you want to integrate an open-source code in your application. The lldpd is published under ISC License, whereas the openlldp is published under GPL-2.0 License. The difference between two licenses is that the ISC License is more permissive than the GPL-2.0 License.

If you use GPL-2.0 licensed open-source code in your application, you need to publish the changes back to the community. In case of ISC License, it is not required to publish your changes back to community. Please note that the scope of the article does not cover the full licensing requirements. Please understand the license before using it in your project.

2. Active Community Support

When picking up open-source code, we should also make sure that the development is active for that code. The development and support in lldpd are more active than the openlldp. When writing this article, there are a total of 8 tags in openlldp and 54 tags in lldpd. This indicates how quickly bugs are fixed and new version is released in lldpd.

3. Supported Protocols

There are other protocols like LLDP to discover the network devices, for example EDP, CDP. When selecting the LLDP open-source code, one should also make sure that it supports other protocols as well. This will make sure that the network devices with other protocols are also discovered. Though I have not verified the protocols listed in the documentations, from the document I can say that the lldpd supports EDP, CDP, FDP, SONMP and the openlldp supports EDP, CDP, EVB, MED, DCBX, VDP.

4. Custom Interface Support

In most of the cases the LLDP would run on standard Ethernet Interface but in some specific cases it may require executing LLDP on non-Ethernet interfaces, like Serial or I2C. In this case, it would be very helpful if the open-source code supports other interfaces. Though both open-source code does not support custom interfaces, the lldpd at least have documentation on how to add the custom interfaces. Adding custom interfaces on openlldp may require more time to understand and implement than lldpd.

5. Multiple Neighbour Support

This is one of the most important features when selecting the LLDP open-source code. Multiple neighbour support is needed if you are supposed to capture more than one LLDP enabled neighbour (network devices) on the same interfaces. As per my understanding, this is very basic feature which should be supported in all LLDP code. But I was surprised to know that this feature is not available in openlldp. Multiple neighbour support is available in lldpd.

6. Daemon Configuration Tool

Daemon configuration tool helps to configure the LLDP parameters, get status, enable/disable interfaces. Both lldpd and openlldp has their configuration tools. The lldpd has lldpcli/lldpctl and the openlldp has lldptool for configuration.

7. LLDP Statistics

Both lldpd and openlldp supports display of interface and neighbour statistics through there configuration tools. The statistics includes Total Frame Outs, Total Error Frame Outs, Total Age Out Frames, Total Discarded Frames, Total Frame In, Total Frame In Errors, Total Discarded Error Frames, Total TLVs in Errors, Total TLV’s Accepted etc.

8. Custom TLV Support

Both the lldpd and openlldp supports reception and transmission of custom TLV’s. The custom TLV’s can be set or get using their configuration tools.

9. SNMP Agent

Both lldpd and openlldp supports SNMP agent.

Comparison table

Based on above points the below table is populated for comparison purpose. One can decide whether lldpd or openlldp should be used in their system or network devices.

8755613068?profile=RESIZE_710x

Conclusion

As per my opinion it is better to choose the lldpd open-source code over the openlldp considering the license, features and community support. The licensing of lldpd is more permissive than the open-lldp. There are more features in lldpd compared to open-lldp. The community support for lldpd is more active than the open-lldp. So unless you have direction from your client to use specific open source lldp package, go for lldpd. eInfochips has in-depth expertise in the areas of firmware design for embedded systems development. We offer end-to-end support for firmware development starting from system requirements to testing for quality and environment.

Originally posted here.

Read more…

How IoT Tools Are Mining Manufacturing's Gold

IIoT will allow assets to perform more cost-effectively – so the better the data, the greater the savings.

Ricardo Buranello

The IoT is enabling advances across multiple market sectors, but it is the Industrial IoT (IIoT) that is having the most impact. It is already the biggest IoT vertical and covers multiple types of projects across industry, from simple data collection to more complex projects incorporating just-in-time manufacturing and predictive quality control.

The biggest benefit of the IIoT is how it is creating innovative solutions to help manufacturers achieve their business objectives by delivering better services and products to their customers. There are three principle reasons for implementing an IIoT application – to make money, to save money, or to stay compliant – and sometimes all three can be delivered. Certainly, at Telit, we would not counsel anyone to consider investing in an IIoT project unless it meets one or more of those three objectives.

Data is the New Gold

A properly implemented IIoT should enable manufacturers to collect data from every step in the process. Every machine can and should produce data, and the processing of that data should deliver invaluable information that helps create more efficient processes and factories. Look back 10-15 years, and there was a big shift in production, with manufacturing operations leaving the U.S. and Europe for China because labor cost was the most important consideration.

The IIoT is set to have the same effect as labor costs; data is the new gold. Information from the IIoT will make manufacturers’ assets perform in a more cost-effective manner – so the better the data, the greater the improvements.

Let’s look at some examples of the transformational effect of the IIoT. One of the largest car vendors in the world implemented a replacement IIoT solution that significantly reduced latency in their systems.This reduction was so relevant that in just one plant it created 3,000 minutes more of uptime. This plant produces at a rate of about $30,000 per minute, so that’s an extra $90 million.

Additionally, integrating the solution operator by operator, line by line and shift by shift, there is now a continuous link between what is being produced and how it is being produced, increasing productivity and quality control. Based on the data gathered, the manufacturer achieved significant reductions in both set-up time and line downtime.

Global names like Mitsubishi and Honda rely on the IIoT to remotely connect sophisticated machinery with technicians and engineers who constantly check manufacturing performance levels, ensure preventative maintenance, and quickly react to any issues that may affect production. Chip giants utilize the IIoT to maintain top-level cybersecurity to protect its IPR from hackers. Multinational pharmaceutical companies use the IIoT to audit every step in the manufacture of their products to ensure full compliance with regulations and laws. 

The IIoT isn’t limited to high end manufacturing. Anything can be connected. In Brazil, the IIoT is used to transmit data about the condition of the sewer network and sends alerts to maintenance crews when cleaning is required. The IIoT can also be used to explain unusual behavior.

At a manufacturing plant In Mexico, an application measuring the productivity of each machine was able to show how one machine was producing less at night than during the morning and afternoon shifts. Upon investigation, it was revealed that the operator on the evening shift was leaving the machine on a regular basis – to chat with his girlfriend.

Manufacturers are embracing the technology and investing, and without needing to hire an army of software engineers to rewrite protocols. There are experts in the IoT space that can deliver guaranteed connectivity across all systems – reducing the implementation time to a couple of days.

The IIoT is changing the face of manufacturing, from predictive maintenance and supply chain management to condition monitoring. Yet only a fraction of the market potential has been explored so far. If you look at the Fortune 500, there isn’t one company that doesn’t have an IIoT application, but in most the technology is yet to permeate the whole organization.

There are huge untapped possibilities, and work to be done to achieve the true revolution that the IIoT promises. This applies not only to the actual manufacturing processes, but throughout the supply chain, leveraging connectivity for better traceability and quality control. The IIoT can, and will, touch, impact, and improve every step.


Ricardo Stefanato Buranello is the Global VP - IoT Factory Solutions for Telit, and has over 14 years of experience in the M2M/IoT industry. Buranello is responsible for Telit’s global factory solutions, which is a leading provider in industrial solutions for remote connectivity, edge logic automation, OT and IT integration.


Read more…

by Evelyn Münster

IoT systems are complex data products: they consist of digital and physical components, networks, communications, processes, data, and artificial intelligence (AI). User interfaces (UIs) are meant to make this level of complexity understandable for the user. However, building a data product that can explain data and models to users in a way that they can understand is an unexpectedly difficult challenge. That is because data products are not your run-of-the-mill software product.

In fact, 85% of all big data and AI projects fail. Why? I can say from experience that it is not the technology but rather the design that is to blame.

So how do you create a valuable data product? The answer lies in a new type of user experience (UX) design. With data products, UX designers are confronted with several additional layers that are not usually found in conventional software products: it’s a relatively complex system, unfamiliar to most users, and comprises data and data visualization as well as AI in some cases. Last but not least, it presents an entirely different set of user problems and tasks than customary software products.

Let’s take things one step at a time. My many years in data product design have taught me that it is possible to create great data products, as long as you keep a few things in mind before you begin.

As a prelude to the UX design process, make sure you and your team answer the following nine questions:

1. Which problem does my product solve for the user?

The user must be able to understand the purpose of your data product in a matter of minutes. The assignment to the five categories of the specific tasks of data products can be helpful: actionable insights, performance feedback loop, root cause analysis, knowledge creation, and trust building.

2. What does the system look like?

Do not expect users to already know how to interpret the data properly. They need to be able to construct a fairly accurate mental model of the system behind the data.

3. What is the level of data quality?

The UI must reflect the quality of the data. A good UI leads the user to trust the product.

4. What is the user’s proficiency level in graphicacy and numeracy?

Conduct user testing to make sure that your audience will be able to read and interpret the data and visuals correctly.

5. What level of detail do I need?

Aggregated data is often too abstract to explain, or to build user trust. A good way to counter this challenge is to use details that explain things. Then again, too much detail can also be overwhelming.

6. Are we dealing with probabilities?

Probabilities are tricky and require explanations. The common practice of cutting out all uncertainties makes the UI deceptively simple – and dangerous.

7. Do we have a data visualization expert on the design team?

UX design applied to data visualization requires a special skillset that covers the entire process, from data analysis to data storytelling. It is always a good idea to have an expert on the team or, alternatively, have someone to reach out to when required.

8. How do we get user feedback?

As soon as the first prototype is ready, you should collect feedback through user testing. The prototype should present content in the most realistic and consistent way possible, especially when it comes to data and figures.

9. Can the user interface boost our marketing and sales?

If the user interface clearly communicates what the data product does and what the process is like, then it could take on a new function: sell your products.

To sum up: we must acknowledge that data products are an unexplored territory. They are not just another software product or dashboard, which is why, in order to create a valuable data product, we will need a specific strategy, new workflows, and a particular set of skills: Data UX Design.

Originally posted HERE 

Read more…

By Adam Dunkels

When you have to install thousands of IoT devices, you need to make device installation impressively fast. Here is how to do it.

Every single IoT device out there has been be installed by someone.

Installation is the activity that requires the most attention during that device’s lifetime.

This is particularly true for large scale IoT deployments.

We at Thingsquare have been involved in many IoT products and projects. Many of these have involved large scale IoT deployments with hundreds or thousands of devices per deployment site.

In this article, we look at why installation is so important for large IoT deployments – and a list of 6 installation tactics to make installation impressively fast while being highly useful:

  1. Take photos
  2. Make it easy to identify devices
  3. Record the location of every device
  4. Keep a log of who did what
  5. Develop an installation checklist, and turn it into an app
  6. Measure everything

And these tactics are useful even if you only have a handful of devices per site, but thousands or tens of thousands of devices in total.

Why Installation Tactics are Important in Large IoT Deployments

Installation is a necessary step of an IoT device’s life.

Someone – maybe your customers, your users, or a team of technicians working for you – will be responsible for the installation. The installer turns your device from a piece of hardware into a living thing: a valuable producer of information for your business.

But most of all, installation is an inevitable part of the IoT device life cycle.

The life cycle of an IoT device can be divided into four stages:

  1. Produce the device, at the factory (usually with a device programming tool).
  2. Install the device.
  3. Use the device. This is where the device generates the value that we created it for. The device may then be either re-installed at a new location, or we:
  4. Retire the device.

Two stages in the list contain the installation activity: both Install and Use.

So installation is inevitable – and important. We need to plan to deal with it.

Installation is the Most Time-Consuming Activity

Most devices should spend most of their lifetime in the Use stage of their life cycle.

But a device’s lifetime is different from the attention time that we need to spend on them.

Devices usually don’t need much attention in their Use stage. At this stage, they should mostly be sitting there and generate valuable information.

By contrast, for the people who work with the devices, most of their attention and time will be spent in the Install stage. Since those are people who’s salary you are paying for, you want to be as efficient as possible.

How To Make Installation Impressively Fast - and Useful

At Thingsquare, we have deployed thousands of devices together with our customers, and our customers have deployed many hundreds of thousands of devices with their customers.

These are our top six tactics to make installation fast – and useful:

1. Take Photos

After installation, you will need to maintain and troubleshoot the system. This is a normal part of the Use stage.

Photos are a goldmine of information. Particularly if it is difficult to get to the location afterward.

Make sure you take plenty of photos of each device as they are installed. In fact, you should include multiple photos in your installation checklist – more about this below.

We have been involved in several deployments where we have needed to remotely troubleshoot installations after they were installed. Having a bunch of photos of how and where the devices were installed helps tremendously.

The photos don’t need to be great. Having a low-quality photo beats having no photo, every time.


2. Make it Easy to Identify Devices

When dealing with hundreds of devices, you need to make sure that you know exactly which you installed, and where.

You therefore need to make it easy to identify each device. Device identification can be made in several ways, and we recommend you to use more than one way to identify the devices. This will reduce the risk of manual errors.

The two ways we typically use are:

  • A printed unique ID number on the device, which you can take a photo of
  • Automatic secure device identification via Bluetooth – this is something the Thingsquare IoT platform supports out of the box

Being certain about where devices were installed will make maintenance and troubleshooting much easier – particularly if it is difficult to visit the installation site.

3. Record the Location of Every Device

When devices are installed, make sure to record their location.

The easiest way to do this is to take the GPS coordinates of the devices as it is being deployed. Preferably with the installation app, which can do this automatically – see below.

For indoor installations, exact GPS locations may be unreliable. But even for those devices, having a coarse-grained GPS location is useful.

The location is useful both when analyzing the data that the devices produce, and when troubleshooting problems in the network.


4. Keep a Log of Who Did What

In large deployments, there will be many people involved.

Being able to trace the installation actions, as well as who took what action, is enormously useful. Sometimes just knowing the steps that were taken when installing each device is important. And sometimes you need to talk to the person who did the installation.

5. Develop an Installation Checklist - and Turn it into an App

Determine what steps are needed to install each device, and develop a step-by-step checklist for each step.

Then turn this checklist into an app that installation personnel can run on their own phones.

Each step of each checklist should be really easy understand to avoid mistakes along the way. And it should be easy to go back and forth in the steps, if needed.

Ideally, the app should run on both Android and iOS, because you would like everyone to be able to use it on their own phones.

Here is an example checklist, that we developed for a sensor device in a retail IoT deployment:

  • Check that sensor has battery installed
  • Attach sensor to appliance
  • Make sure that the sensor is online
  • Check that the sensor has a strong signal
  • Check that the GPS location is correct
  • Move hand in front of sensor, to make sure sensor correctly detects movement
  • Be still, to make sure sensor correctly detects no movement
  • Enter description of sensor placement (e.g. “on top of the appliance”)
  • Enter description of appliance
  • Take a photo of the sensor
  • Take a photo of the appliance
  • Take a photo of the appliance and the two beside it
  • Take a photo of the appliance and the four beside it
 

6. Measure Everything

Since installation costs money, we want it to be efficient.

And the best way to make a process more efficient is to measure it, and then improve it.

Since we have an installation checklist app, measuring installation time is easy – just build it into the app.

Once we know how much time each step in the installation process needs, we are ready to revise the process and improve it. We should focus on the most time-consuming step first and measure the successive improvements to make sure we get the most bang for the buck.

Conclusions

Every IoT device needs to be installed and making the installation process efficient saves us attention time for everyone involved – and ultimately money.

At Thingsquare, we have deployed thousands of devices together with our customers, and our customers have deployed many hundreds of thousands of devices with their customers.

We use our experience to solve hard problems in the IoT space, such as how to best install large IoT systems – get in touch with us to learn more!

Originally posted here.

Read more…

“Productivity isn’t everything, but in the long run, it is almost everything.” This well-known quote is attributed to Paul Krugman, the well-known American economist and winner of a Nobel Memorial Prize in Economic Sciences for his contributions to New Trade Theory and New Economic Geography.

In economic terms, a common definition of productivity cites it as the ratio between the volume of outputs and the volume of inputs. It measures the efficiency of production inputs – labor and capital – used to produce a given level of output.

 
For countries and companies alike, productivity gain is a fundamental goal. For countries, productivity leads to higher real income, which contributes to higher living standards and better social services.

For companies, productivity is a key driver of sustainable profits and competitiveness over time. The global economy, with open markets and wide competition, pushes companies for constant productivity gains. Companies that fail in the race for productivity are the perfect candidates for extinction in the near future.


Productivity can be boosted in a few different ways, most notably through the innovation of new products or through new business models that guarantee higher scalability and demand. One example is how Starbucks built a sustainable business model with high levels of productivity through the deployment of strong, intangible assets such as a unique brand and efficient business processes.

Another example is Apple, a company that executed its strategy to perfection, creating a legion of fans that constantly run to buy the company’s new products, and sometimes even camp overnight outside an Apple store to get a device before it sells out. Apple succeeded not only in designing some of the most desired smartphones and PCs on the market but also in creating a business platform that generates incremental service and software revenue on top of its products. In 2020, about 15% of Apple’s revenue came from services, leveraged by its platform strategy.

Another important factor in productivity is the innovation inside. That is, how to produce more with fewer resources. While in the past few decades industrial efficiency was boosted by moving factories to low labor cost economies, this recipe is getting exhausted. The cost increase in Asian countries, driven by higher salaries, geopolitical risks and the increase in automation levels is changing the balance of this equation.

In an environment of hyper-competition and open markets, technology is rapidly reshaping manufacturing. The companies that survive in this new paradigm will be those that adopt data-driven models, innovate on their products and services, and embrace the challenge of producing more with less. I believe IoT and Industry 4.0 will be the drivers of this transformation.

Start With Management

Everything starts with management. Managers need to embrace innovation and constant improvement. Processes need to be quantified, and efficiency ratios for each of the individual processes need to be measured. For example, overall equipment effectiveness (OEE) needs to be calculated per machine, line, operator, sector and plant. Such KPIs are important to enable managers to make real-time decisions.

Include Machines

If data-driven management is the goal, then it’s time to think about execution. The ability to collect data from a variety of different machines and from a variety of different vendors is a big challenge. Industrial machines in general don’t have a common protocol and as such, collecting the data in a highly efficient manner can be challenging and daunting.

Beyond connecting machines themselves, machine data needs to be efficiently integrated across different IT systems and software, such as manufacturing execution systems (MES), enterprise resource planning (ERP) software and a variety of database applications. On top of that, there comes the challenge of building and integrating higher-level functionality, such as edge logic for real-time actions, data visualization for operators and managers, data analytics, cloud computing, machine learning and the list goes on. The complexity and associated challenges of machine and data integration cause many companies to fail along the way.

Avoid The Custom Code Trap

Many companies fail in the execution, and one of the reasons is because it is not a simple task. As IIoT is a relatively new concept, the market is not fully matured. Many companies create their own internal team and start to code. The problem is companies may not be prepared – they often lack the right level of skills, people, and expertise. It's not impossible to execute internally, but oftentimes focusing on your core business and finding the best technology tools for your needs in the market is the more efficient choice.

If you're looking at outside teams, a good way to avoid high development costs and operations risk is to find an integrated platform that merges data collection, edge computing and information technology/operational technology (IT/OT) integration. The more vertically integrated, the faster the deployment and the less likely you will need "Band-Aids" to integrate systems. This will provide more flexibility and optimize performance while reducing the cost and risks of the project.

It’s also important to remember that innovation and productivity is more than a task. It is a journey. Processes need to constantly evolve, and your IIoT platform must provide the ability to be flexible when you need to change machines, systems, metrics and processes.

In the end, productivity excellence is a blend of management, creativity and technology. It means pushing people out of their comfort zone and augmenting possibilities with technology. Not easy, but certainly needed.


Read more…

By Natallia Babrovich

My experience shows that most of the visits to doctors are likely to become virtual in the future. Let’s see how IoT solutions make the healthcare environment more convenient for patients and medical staff.

What are IoT and IoMT?

My colleague Alex Grizhnevich, IoT consultant at ScienceSoft, defines Internet of Things as a network of physical devices with sensors and actuators, software, and network connectivity that enable devices to gather and transmit data and fulfill users' tasks. Today, IoT becomes a key component of the digital transformation of healthcare, so we can distinguish a separate group of initiatives, the so-called IoHT (Internet of Health Things) or IoMT (Internet of Medical Things).

Popular IoMT Use Cases

IoT-based patient care

Medication intake tracking

IoT-based medication tracking allows doctors to monitor the impact of a prescribed medication’s dosage on a patient’s condition. In their turn, patients can control medication intake, e.g., by using in-app reminders and note in the app how their symptoms change for their doctor’s further analysis. The patient app can be connected to smart devices, (e.g., a smart pill bottle) for easier management of multiple medications.

Remote health monitoring

Among examples of employing IoT in healthcare, this use case is especially viable for chronic disease management. Patients can use connected medical devices or body-worn biosensors to allow doctors or nurses to check their vitals (blood pressure, glucose level, heart rate, etc.) via doctor/nurse-facing apps. Health professionals can monitor this data 24/7 and study app-generated reports to get insights into health trends. Patients who show signs of deteriorating health are scheduled for in-person visits.

IoT- and RFID-based medical asset monitoring

Medical inventory and equipment tracking

All medical tools and durable assets (beds, medical equipment) are equipped with RFID (radio frequency identification) tags. Fixed RFID readers (e.g., on the walls) collect the info about the location of assets. Medical staff can view it using a mobile or web application with a map.

Drug tracking

RFID-enabled drug tracking helps pharmacies and hospitals verify the authenticity of medication packages and timely spot medication shortages.

Smart hospital space

Cloud-connected ward sensors (e.g., a light switch, door and window contacts) and ambient sensors (e.g., hydrometers, noise detectors) allow patients to control their environment for a comfortable hospital stay.

Advantages of using IoT technology in healthcare

Patient-centric care

Medical IoT helps turn patients into active participants of the treatment process, thus improving care outcomes. Besides, IoMT helps increase patient satisfaction with care delivery, from communication with medical staff to physical comfort (smart lighting, climate control, etc.).

Reduced care-related costs

Non-critical patients can stay at home and use cloud-connected medical IoT devices, which gather, track and send health data to the medical facility. And with the help of telehealth technology, patients can schedule e-visits with nurses and doctors without traveling to the hospital.

Reduced readmissions

Patient apps connected to biosensors help ensure compliance with a discharge plan, enable prompt detection of health state deviations, and provide an opportunity to timely contact a health professional remotely.

Challenges of IoMT and how to address them

Potential health data security breaches

The connected nature of IoT brings about information security challenges for healthcare providers and patients.

Tip from ScienceSoft

We recommend implementing HIPAA-compliant IoMT solutions and conduct vulnerability assessment and penetration testing regularly to ensure the highest level of protection.

Integration difficulties

Every medical facility has its unique set of applications to be integrated with an IoMT solution (e.g., EHR, EMR). Some of these applications may be heavily customized or outdated.

Tip from ScienceSoft

Develop the integrations strategy from the start of your IoMT project, including the scope and the nature of custom integrations.

Enhance care delivery with IoMT

According to my estimates, the use of IoT technology in healthcare will continue to rise during the next decade, driven by the impact of the COVID situation and the growing demand for remote care. If you need help with creating and implementing a fitting IoMT solution, you’re welcome to turn to ScienceSoft’s healthcare IT team.

Originally posted here.

Read more…

By Sanjay Tripathi, Lauren Luellwitz, and Kevin Egge

There are petabytes of data generated by intelligent, interconnected and autonomous systems of Industry 4.0. When combined with artificial intelligence tools that provide actionable insight, it has the potential to improve every function within a plant, i.e. operations, engineering, quality, reliability and maintenance.

The maintenance function, while crucial to the smooth functioning of a plant has, until recently not seen much innovation. Many among us have experienced the equipment downtime, process drifts, massive hits to yield, and decline in product reliability because of maintenance performed poorly or late. Yet, Enterprise Asset Management (EAM) systems – ERP systems that help maintain assets – remained as systems of record that typically generated work-orders and recorded maintenance performed. Even as production processes became mind-numbingly complex, EAM systems remained much the same.

IBM Maximo 8.0, or Maximo Application Suite, is one example of a system that combines artificial intelligent (AI), big data and cloud computing technologies with domain expertise from operating technologies (OT) to simplify maintenance and deliver production resilience.

Maximo 8.0 leverages AI to visually inspect gas pipelines, rail tracks, bridges and tunnels; AI guides technicians as they conduct complex repairs; it provides maintenance supervisors real-time visibility into the health and safety of their technicians. Domain expertise is incorporated in the form of data to train AI models. These capabilities improve the ability to avoid unscheduled downtime, improve first-time-fix rate, and reduce safety incidents.

Maintenance records residing in Maximo are combined with real-time operational data from production assets and their associated asset model to better predict when maintenance is required. In this example, asset models embody domain expertise. These models characterize how a production asset such as a power generator or catalytic converter should perform in the context of where it is installed in the process.

The Maximo application itself is encapsulated (containerized) using Red Hat’s OpenShift technology. Containerization allows the application to be easily deployed on-premises, on private clouds or hybrid clouds. This flexibility in deployment benefits IT organizations that need to continually evolve their infrastructure, which is almost every organization.

Maximo 8.0 is available as a suite that includes both core and advanced capabilities. A single software entitlement provides access to all capabilities. The entitlement provides access to the core EAM functionality of work and resource scheduling, asset management, industry-specific customizations, EHS guidelines, and mobile functionality. And it provides access to advanced functionality such as Maximo Monitor, which automatically detects anomalies in how an asset may be performing; Maximo Health, which measures equipment health; Maximo Predict, which, as the name suggests, predicts when maintenance is required; and Maximo Assist which assists technicians conduct repairs.

Originally posted here.

Read more…

by Olivier Pauzet

Over the past year, we have seen the Industrial IoT (IIoT) take an important step forward, crossing the chasm that previously separated IIoT early adopters from the majority of companies.

New solutions like Octave, Sierra Wireless’ edge-to-cloud solution for connecting industrial assets, have greatly simplified the IIoT, making it possible now for practically any company to securely extract, transmit, and act on data from bio-waste collectors, liquid fertilizer tanks, water purifiers, hot water heaters and other industrial equipment.

So, what IIoT trends will these 2020 developments lead to in 2021? I expect that they will drive greater adoption of the IIoT next year, as manufacturing, utility, healthcare, and other organizations further realize that they can help their previously silent industrial assets speak using the APIs integrated in new IoT solutions. At the same time, I expect we will start to see the development of some revolutionary IIoT applications that use 5G’s Ultra-Reliable, Low-Latency Communications (URLLC) capabilities to change the way our factories, electric grid, and healthcare systems operate.

In 2021, Industrial Equipment APIs Will Give Quiet Equipment A Voice

Cloud APIs have transformed the tech industry, and with it, our digital economy. By enabling SaaS and other cloud-based applications to easily and securely talk to each other, cloud APIs have vastly expanded the value of these applications to users. These APIs have also spawned billion-dollar companies like Stripe, Tableau, and Twilio, whose API-focused business models have transformed the online payments, data visualization, and customer service markets.

2021 will be the year industrial companies begin seeing their markets transformed by APIs, as more of these companies begin using industrial equipment APIs built into new IIoT solutions to enable their industrial assets to talk to the cloud.

Using new edge-to-cloud solutions - like Octave -with built-in Industrial equipment APIs for Modbus and other industrial communications protocols, these companies will be able to securely connect these assets to the cloud almost as easily as if this equipment was a cloud-based application.

In fact, by simply plugging a low-cost IoT gateway with these IIoT APIs into their industrial equipment, they will be able to deploy IIoT applications that allow them to remotely monitor, maintain, and control this equipment. Then, using these applications, they can lower equipment downtime, reduce maintenance costs, launch new Equipment-as-a-Service business models, and innovate faster.

Industrial companies have been trying to connect their assets to the cloud for years, but have been stymied by the complexity, time, and expense involved in doing so. In 2021, industrial equipment APIs will provide these companies with a way to simply, quickly, and cheaply connect this equipment to the cloud. By giving a voice to billions of pieces of industrial equipment, these Industrial IoT APIs will help bring about the productivity, sustainability, and other benefits Industry 4.0 has long promised.

In 2021 Manufacturing, Utility and Healthcare Will Drive Growth of the Industrial IoT

Until recently, the consumer sector, and especially the smart home market, has led the way in adopting the IoT, as the success of the Google Nest smart thermostat, the Amazon Echo smart speaker and Ring smart doorbell, and the Phillips Hue smart lights demonstrate. However, in 2021 another IIoT trend we can expect to see is the industrial sector starting to catch up to the consumer market regarding the IoT, with the manufacturing, utility, and healthcare markets leading the way.

For example, new IIoT solutions now make it possible for Original Equipment Manufacturers (OEMs) and other manufacturing companies to simply plug their equipment into the IIoT and begin acting on data from this equipment almost immediately. This has lowered the time to value for IIoT applications to the point where companies can begin reaping financial benefits greater than the total cost for their IIoT application in a few short months.

At this point, manufacturers who don’t have a plan to integrate the IIoT into their assets are, to put it bluntly, leaving money on the table – money their competitors will happily snap up with their own new connected industrial equipment offerings if they do not.

Like manufacturing companies, utilities will ramp up their use of the IIoT in 2021, as they seek to improve their operational efficiency, customer engagement, reliability, and sustainability. For example, utilities will increasingly use the IIoT to perform remote diagnostics and predictive maintenance on their grid infrastructure, reducing this equipment’s downtime while also lowering maintenance costs. In addition, a growing number of utilities will use the IIoT to collect and analyze data on their wind, solar and other renewable energy generation portfolios, allowing them to reduce greenhouse gas emissions while still balancing energy supply and demand on the grid.

Along with manufacturing and utilities, healthcare is the third market sector I expect to lead the way in adopting the IIoT in 2021. The COVID-19 pandemic has demonstrated to healthcare providers how connectivity – such as Internet-based telemedicine solutions -- can improve patient outcomes while reducing their costs. In 2021 they will increase their use of the IIoT, as they work to extend this connectivity to patient monitors, scanners and other medical devices. With the Internet of Medical Things (IoMT), healthcare providers will be better able to prepare patient treatments, remotely monitor and respond to changes to their patients’ conditions, and generate health care treatment documents.

Revolutionary Ultra-Reliable, Low-Latency 5G Applications Will Begin to Be Developed

There is a lot of buzz regarding 5G New Radio (NR) in the IIoT market. However, having been designed to co-exist with 4G LTE, most of 5G NR’s impact in this market is still evolutionary, not revolutionary. Companies are beginning to adopt 5G to wring better performance out of their existing IIoT applications, or to future-proof their connectivity strategies. But they are doing this while continuing to use LTE, as well as Low Power Wide Area (LPWA) 5G technologies, like LTE-M and NB-IoT, for now.

In 2021 however I think we will begin to see companies starting to develop revolutionary new IIoT application proof of concepts designed to take advantage of 5G NR’s Ultra-Reliable, Low-Latency Communications (URLLC) capabilities. These URLLC applications – including smart Automated Guided Vehicle (AGVs) for manufacturing, self-healing energy grids for utilities and remote surgery for health care – are simply not possible with existing wireless technologies.

Thanks to its ability to deliver ultra-high reliability and latencies as low as one millisecond, 5G NR enables companies to finally build URLLC applications – especially when 5G NR is used in conjunction with new edge computing technologies.

It will be a long time before any of these URLLC application proof-of-concepts are commercialized. But as far as 5G Wave 5+, next year is when we will first begin seeing this wave forming out at sea. And when it does eventually reach shore, it will have a revolutionary impact on our connected economy.

Originally posted here.

Read more…

As the Internet of Things (IoT) grows rapidly, huge amounts of wireless sensor networks emerged monitoring a wide range of infrastructure, in various domains such as healthcare, energy, transportation, smart city, building automation, agriculture, and industry producing continuously streamlines of data. Big Data technologies play a significant role within IoT processes, as visual analytics tools, generating valuable knowledge in real-time in order to support critical decision making. This paper provides a comprehensive survey of visualization methods, tools, and techniques for the IoT. We position data visualization inside the visual analytics process by reviewing the visual analytics pipeline. We provide a study of various chart types available for data visualization and analyze rules for employing each one of them, taking into account the special conditions of the particular use case. We further examine some of the most promising visualization tools. Since each IoT domain is isolated in terms of Big Data approaches, we investigate visualization issues in each domain. Additionally, we review visualization methods oriented to anomaly detection. Finally, we provide an overview of the major challenges in IoT visualizations.

Internet of Things (IoT) has become one of the most emerging and powerful technologies that is used to improve the quality of life. IoT connects together a great number of heterogeneous devices in order to dynamically acquire various types of data from the real-world environment. IoT data is used to mine useful information that may be used, by context-aware applications, in order to improve people’s daily life. As data is typically featured with contextual information (time, location, status, etc), IoT turns into a valuable and voluminous source of contextual data with variety (several sources), velocity (real-time collection), veracity (uncertainty of data) and value. The cooperation of Big Data and IoT has initiated the development of smart services for many complex infrastructures. As IoT develops rapidly, Big Data technologies play a critical role, as visual analytics tools, producing valuable knowledge in real-time, within the IoT infrastructures, aiming in supporting critical decision making. Large-scale IoT applications employ a large number of sensors resulting in a very large amount of collected data. In the context of IoT data analysis, two tasks are of relevance: exploring the large amounts of data to find subsets and patterns of interest, and; analyzing the available data to make assessments and predictions. This paper will exploit ways to gain insight from IoT Data using meaningful visualizations. Visual analytics is an analysis technique that can assist the exploration of vast amounts of data by utilizing data mining, statistics, and visualization. Interactive visualization tools combine automated analysis and human interaction allowing user control during the data analysis process, aiming in producing valuable insight for decision making. They involve custom data visualization methods that enable the operator to interact with them, in order to view data through different perspectives and focus on details of interest. Data analytics methods involve machine learning and AI methods, to automatically extract patterns from data and make predictions. AI methods are usually untrustworthy to their operators, due to their black-box operation that does not provide insight into the accuracy of their results. Visual analytics can be used to make AI methods more transparent and explainable, visualizing both their results and the way they work.

Visual Analytics

Visual Analytics is a data analysis method that employs data mining, statistics, and visualization. Besides automated analysis, implementations of visual analytics tools combine human interaction allowing user control and judgment during data analysis, in order to produce valuable insight for decision making. Over the years, numerous research studies on visual analytics were conducted. Most of them deal with a conventional visual analytics pipeline originally presented by Keim et al which depicts the visual analytics process. As figure1 illustrates, the visual analytics process starts performing data transformation subprocesses, such as filtering and sampling, that modify the data set into representations enabled for further exploration. To create knowledge, the pipeline adopts either a visual exploration method or an automatic analysis method, depending on the specific use case. In the case of automatic analysis, data mining methods are applied to assist the characterization of the data. The visual interface is operated by analysts and decision-makers, to explore and analyze the data. The framework of the Visual Analytics Pipeline has four core concepts: Data, Models, Visualization, and Knowledge. The Data module is responsible for the collection and pre-processing of the raw and heterogeneous data. As data acquisition is done in real-time through sensors, raw data sets are usually incomplete, noisy, or inconsistent making it impossible for them to be used directly in the Visualization or in the Models module. In order to eliminate these difficulties, some data pre-processing has to be applied to the original data sets. Data pre-processing is a flexible process, depending on the quality of raw data. This module includes pre-processing techniques such as data parsing, data integration, data cleaning (elimination of redundancy, errors, and invalid data), data transformation (normalization), and data reduction. The Models module, is responsible for converting data to information. This module includes conversion methods such as feature selection and generation, model building, selection, and validation.

Visual Analytics Pipeline

The Visualization module is responsible for visualizing and abstractly transforming the data. This module includes techniques for visual mapping (parallel coordinates, force-directed graphs, chord graphs, scatter matrices), view generation and coordination, human-computer interaction. The Knowledge module is responsible for driving the process of transforming information into meaningful insight using human machine interaction methods. 3 Visualization Charts Rules and Tools Data visualization places data in an appropriate visual context that triggers people’s understanding of its significance. This reduces the overall effort to manually analyze the data. As a result, visualization and recognition of patterns within the IoT generated data, play a significant role in the insight-gaining process, and enhance the decision-making process. Visualizing data plays a major role in data analytics since it manifests the presentation of findings and its patterns concurrently with the original data. Data visualization helps to interpret the results by correlating the findings to the goals. It also exposes hidden patterns, trends, and correlations, that otherwise would be undetected, in an impactful and perceptible manner. As a result, it assists the creation of good storytelling in terms of data and data pattern understanding. In this section, we will address different types of data charting. Also, we will analyze chart selection rules, that take into account special conditions that hold for a particular use case. Moreover, we will present the most popular IoT visualization tools. 

Different Tools For IoT Data Visualization

IoT Data Visualization Tools Visualization tools assist the decision-making process since they provide strong data analytics that help interpreting big data acquired from the various IoT devices. IoT data visualization systems involve custom dashboard design that, given a set of measurements acquired by several geographically scattered IoT sensors, and several AI models applied to the data, allows the operator to explore the available raw measurements and gain insight about the models’ operation. The main aim of these systems is to enhance the operator’s trust in the models. A flexible visualization system should maintain some core characteristics such as the ability to update in real-time, interactivity, transparency, and explainability. Since, IoT measurements are highly dynamic, with new measurements being collected in real-time, dashboards should be able to update in real-time as new measurements become available. The dashboard should provide an interactive user interface allowing operators to engage with the data and explore them. The dashboard should also provide means of looking into the applied AI models and visualize their internals, to enhance the transparency and explainability of the models. Many proposed visualization platforms are designed based on SOA (Service Oriented Architecture) with four key services: Data Collection Service, that receives data; Data Visualization Service, that observes the data intuitively; Dynamic Dashboard Service, providing an interface that organizes and displays various information such as text, the value of the machine, or the visualization result; and Data Analytic Service, that delivers statistical analysis tools and consists of three main layers Big Data Infrastructure as a Service, Big Data Platform as a Service, and Big Data Analytics Software as a Service. The most widely used IoT Data visualization tools, across several industries globally, will be summarized in this section. Each one was compared against the following criteria: open-source tool, the ability to integrate with popular data sources (MapR Hadoop Hive, Salesforce, Google Analytics, Cloudera Hadoop, etc.), interactive visualization, client-type (desktop, online or mobile app), availability of APIs for customization and embedding purposes.

Tableau is a fast and flexible data visualization tool, allowing user interaction. Its user interface provides a wide range of fixed and custom visualizations employing a great variety of intuitive charts. In-depth analyses may be accomplished by R-scripting. It supports most data formats and connections to various servers such as Amazon Aurora, Cloudera Hadoop, and Salesforce. Tableau’s online service is publicly available but it supports limited storage. Server and desktop versions are available under commercial licenses. ThingsBoard is an open-source IoT platform containing modules for device management, data collection, processing, and visualization. The platform allows the creation of custom IoT dashboards containing widgets that visualize sensor data collected through multiple devices. It contains a set of features including line and bar chart modules for both historical and real-time data visualizations. It also contains map widgets enabling object tracking on online maps. Its complex stack technology (Java, Python, C++, JavaScript) provides error-free performance and real-time data analytics. It supports standard IoT protocols for device connectivity (e.g. MQTT, CoAP, and HTTP). It can be integrated with Node-Red, a flow-based programming platform for IoT, through a custom function. Plotly is an online cloud-based public data visualization service. It is built using Python and Django frameworks. It provides various data storage services and modules for IoT visualization and analytics. It allows the creation of online dashboards employing a wide range of charts such as statistical, scientific, 3D, multiple axes charts, etc. It provides Python, R, MATLAB and Julia based APIs for in-depth analyses. Also, graphics libraries such as ggplot2, matplotlib, and MATLAB chart conversion techniques enhance the visualizations. Its internal tool Web Plot Digitizer (WPD) may automatically grab data from static images. It is publicly available with limited chart features and storage while its full set of chart features are available through a professional membership license. IBM Watson IoT Platform is a cloud platform as a service supporting several programming languages, services, and integrated DevOps in order to deploy and manage cloud applications. It features a set of built-in web applications while it provides support for 3rd-party software integration via REST APIs. The visualization of static and dynamic data is provided through effortless creation of custom diagrams, graphs, and tables. It provides access to device properties and alert management. Node-RED may be used for IoT device connection, APIs, and online services. Sensor data, stored in Cloudant NoSQL DB, may be processed for further data analysis. Power BI is a powerful business analytics service based on the cloud. It provides a rich set of interactive visualizations and detailed analysis reports for large enterprises. It is designed to trace and visualize various sensor gathered data. The platform works in cooperation with Azure cloud-based analytics and cognitive services. It consists of 3 basic components: Power BI Desktop, report generator; Service (SaaS), report publisher; and Apps, report viewer, and dashboard. Numerous types of source integrations are supported while rich data visualizations are also provided. Among other methods, data may be queried using the natural language query feature. Data analysis is accomplished both in real-time streaming and static historic data. Power BI provides sub-components that enable IoT integration.  

These days, Immersive Virtual Reality is recognized as one of the most promising technologies that enables virtual interactions with physical systems. The user is situated within a 3D environment where data visualizations and physical space are matched in a sense that it provides users the ability to orient, navigate, and interact naturally. These frameworks utilize hybrid collaborative multi-modal methods to enable collaboration between users and provide intuitive and natural interaction within a specific virtual environment. As users remain immersed within a 3D virtual environment, immersive reality applications require sophisticated approaches for interacting with the IoT data analytics visualization. As such, immersive analytics is the visualization outcome within IoT infrastructures. Immersive analytics frameworks promote a better understanding of the IoT Services and enhance decision-making. To ensure such a collaborative virtual environment presupposes highly responsive connectivity that may be accomplished by employing high-speed 5G network infrastructures, which provide ultra-low-delay and ultra-high-reliable communications. Similarly, a Cyber-Physical System (CPS) is a set of physical devices, connected through a communication network, that communicates with its virtual cyberspace. Each physical object is associated with a cyber model that stores all information and knowledge of it. This cyber model is called “Digital Twin”. It allows data transfer from the physical to the cyber part. However, in a specific CPS, where every physical object has a digital twin counterpart, the spatiotemporal relations between the individual digital twins are far more valuable than the actual digital twin. The generation of Digital twins may be accomplished using 3D technologies through AR/VR/MR or even hologram devices. Digital twins integrate various technologies such as Haptics, Humanoid Robotics as well as Soft Robotics, 5G and Tactile Internet, Cloud Computing Offloading, Wearable technology, IoT Services, and AI.

IoT domains and Visualization

IoT technologies have already entered into various significant domains of our life. The growing market competition and inexpensive connectivity have emerged the Internet of things (IoT) across many domains. Connected sensors, devices, and machines via the Internet are the “things” in IoT. The enormous volume of IoT data provides the information needed to be analyzed to gain knowledge. Visual analytics, involving data analysis methods, artificial intelligence, and visualization, aims to improve domain operations with concerning efficiency, flexibility, and safety. The employment of IoT smart devices facilitates the transformation of traditional domains into modern, smart, and autonomous domains. Over the past recent years, many traditional domains such as healthcare, energy, industry, transportation, city and building management, and agriculture have become IoT-based with intelligent human-to-machine (H2M) and machine-to-machine (M2M) communication.  

Challenges and Future Work

Visual analytics main objective is to discover knowledge and produce actionable insight. This is succeeded by processing large and complex data sets through by integrating techniques from various fields such as data analysis, data management, visualization, knowledge discovery, analytical reasoning, human perception, and human-computer interaction. Even though visualization is an important entity in Big IoT data analytics, most visualization tools exhibit poor performance results in terms of functionality, scalability, interaction, infrastructure, insight creation, and evaluation.

Conclusion

The emergence of IoT Services increased drastically the growth rate of data production creating large and complex data sets. The integration of human judgment within the data analysis process enables visual analytics in discovering knowledge and gaining valuable insight from these data sets. In this process, every piece of IoT data is considered crucial for the extraction of information and useful patterns. Human cognitive and perceptual capabilities identify patterns efficiently when data is represented visually. Data visualization methods face several challenges in handling the voluminous and streaming IoT data without compromising performance and response time matters.


Read more…

Then it seemed that overnight, millions of workers worldwide were told to isolate and work from home as best as they could. Businesses were suddenly forced to enable remote access for hundreds or thousands of users, all at once, from anywhere across the globe. Many companies that already offered VPN services to a small group of remote workers scurried to extend those capabilities to the much larger workforce sequestering at home. It was a decision made in haste out of necessity, but now it’s time to consider, is VPN the best remote access technology for the enterprise, or can other technologies provide a better long-term solution?

Long-term Remote Access Could Be the Norm for Some Time

Some knowledge workers are trickling back to their actual offices, but many more are still at home and will be for some time. Global Workplace Analytics estimates that 25-30% of the workforce will still be working from home multiple days a week by the end of 2021. Others may never return to an official office, opting to remain a work-from-home (WFH) employee for good.

Consequently, enterprises need to find a remote access solution that gives home-based workers a similar experience as they would have in the office, including ease of use, good performance, and a fully secure network access experience. What’s more, the solution must be cost effective and easy to administer without the need to add more technical staff members.

VPNs are certainly one option, but not the only one. Other choices include appliance-based SD-WAN and SASE. Let’s have a look at each approach.

VPNs Weren’t Designed to Support an Entire Workforce

While VPNs are a useful remote access solution for a small portion of the workforce, they are an inefficient technology for giving remote access to a very large number of workers. VPNs are designed for point-to-point connectivity, so each secure connection between two points – presumably a remote worker and a network access server (NAS) in a datacenter – requires its own VPN link. Each NAS has a finite capacity for simultaneous users, so for a large remote user base, some serious infrastructure may be needed in the datacenter.

Performance can be an issue. With a VPN, all communication between the user and the VPN is encrypted. The encryption process takes time, and depending on the type of encryption used, this may add noticeable latency to Internet communications. More important, however, is the latency added when a remote user needs access to IaaS and SaaS applications and services. The traffic path is convoluted because it must travel between the end user and the NAS before then going out to the cloud, and vice versa on the way back.

An important issue with VPNs is that they provide overly broad access to the entire network without the option of controlling granular user access to specific resources. Stolen VPN credentials have been implicated in several high-profile data breaches. By using legitimate credentials and connecting through a VPN, attackers were able to infiltrate and move freely through targeted company networks. What’s more, there is no scrutiny of the security posture of the connecting device, which could allow malware to enter the network via insecure user devices.

SD-WAN Brings Intelligence into Routing Remote Users’ Traffic

Another option for providing remote access for home-based workers is appliance-based SD-WAN. It brings a level of intelligence to the connectivity that VPNs don’t have. Lee Doyle, principal analyst with Doyle Research, outlines the benefits of using SD-WAN to connect home office users to their enterprise network:

  • Prioritization for mission-critical and latency-sensitive applications
  • Accelerated access to cloud-based services
  • Enhanced security via encryption, VPNs, firewalls and integration with cloud-based security
  • Centralized management tools for IT administrators

One thing to consider about appliance-based SD-WAN is that it’s primarily designed for branch office connectivity—though it can accommodate individual users at home as well. However, if a company isn’t already using SD-WAN, this isn’t a technology that is easy to implement and setup for hundreds or thousands of home-based users. What’s more, a significant investment must be made in the various communication and security appliances.

SASE Provides a Simpler, More Secure, Easily Scalable Solution

Cato’s Secure Access Service Edge (or SASE) platform provides a great alternative to VPN for remote access by many simultaneous workers. The platform offers scalable access, optimized connectivity, and integrated threat prevention that are needed to support continuous large-scale remote access.

Companies that enable WFH using Cato’s platform can scale quickly to any number of remote users with ease. There is no need to set up regional hubs or VPN concentrators. The SASE service is built on top of dozens of globally distributed Points of Presence (PoPs) maintained by Cato to deliver a wide range of security and networking services close to all locations and users. The complexity of scaling is all hidden in the Cato-provided PoPs, so there is no infrastructure for the organization to purchase, configure or deploy. Giving end users remote access is as simple as installing a client agent on the user’s device, or by providing clientless access to specific applications via a secure browser.

Cato’s SASE platform employs Zero Trust Network Access in granting users access to the specific resources and applications they need to use. This granular-level security is part of the identity-driven approach to network access that SASE demands. Since all traffic passes through a full network security stack built into the SASE service, multi-factor authentication, full access control, and threat prevention are applied to traffic from remote users. All processing is done within the PoP closest to the users while enforcing all corporate network and security policies. This eliminates the “trombone effect” associated with forcing traffic to specific security choke points on a network. Further, admins have consistent visibility and control of all traffic throughout the enterprise WAN.

SASE Supports WFH in the Short-term and Long-term

While some workers are venturing back to their offices, many more are still working from home—and may work from home permanently. The Cato SASE platform is the ideal way to give them access to their usual network environment without forcing them to go through insecure and inconvenient VPNs.

Originally posted here

Read more…

When I think about the things that held the planet together in 2020, it was digital experiences delivered over wireless connectivity that made remote things local.

While heroes like doctors, nurses, first responders, teachers, and other essential personnel bore the brunt of the COVID-19 response, billions of people around the world found themselves cut off from society. In order to keep people safe, we were physically isolated from each other. Far beyond the six feet of social distancing, most of humanity weathered the storm from their homes.

And then little by little, old things we took for granted, combined with new things many had never heard of, pulled the world together. Let’s take a look at the technologies and trends that made the biggest impact in 2020 and where they’re headed in 2021:

The Internet

The global Internet infrastructure from which everything else is built is an undeniable hero of the pandemic. This highly-distributed network designed to withstand a nuclear attack performed admirably as usage by people, machines, critical infrastructure, hospitals, and businesses skyrocketed. Like the air we breathe, this primary facilitator of connected, digital experiences is indispensable to our modern society. Unfortunately, the Internet is also home to a growing cyberwar and security will be the biggest concern as we move into 2021 and beyond. It goes without saying that the Internet is one of the world’s most critical utilities along with water, electricity, and the farm-to-table supply chain of food.

Wireless Connectivity

People are mobile and they stay connected through their smartphones, tablets, in cars and airplanes, on laptops, and other devices. Just like the Internet, the cellular infrastructure has remained exceptionally resilient to enable communications and digital experiences delivered via native apps and the web. Indoor wireless connectivity continues to be dominated by WiFi at home and all those empty offices. Moving into 2021, the continued rollout of 5G around the world will give cellular endpoints dramatic increases in data capacity and WiFi-like speeds. Additionally, private 5G networks will challenge WiFi as a formidable indoor option, but WiFi 6E with increased capacity and speed won’t give up without a fight. All of these developments are good for consumers who need to stay connected from anywhere like never before.

Web Conferencing

With many people stuck at home in 2020, web conferencing technology took the place of traveling to other locations to meet people or receive education. This technology isn’t new and includes familiar players like GoToMeeting, Skype, WebEx, Google Hangouts/Meet, BlueJeans, FaceTime, and others. Before COVID, these platforms enjoyed success, but most people preferred to fly on airplanes to meet customers and attend conferences while students hopped on the bus to go to school. In 2020, “necessity is the mother of invention” took hold and the use of Zoom and Teams skyrocketed as airplanes sat on the ground while business offices and schools remained empty. These two platforms further increased their stickiness by increasing the number of visible people and adding features like breakout rooms to meet the demands of businesses, virtual conference organizers, and school teachers. Despite the rollout of the vaccine, COVID won’t be extinguished overnight and these platforms will remain strong through the first half of 2021 as organizations rethink where and when people work and learn. There’s way too many players in this space so look for some consolidation.

E-Commerce

“Stay at home” orders and closed businesses gave e-commerce platforms a dramatic boost in 2020 as they took the place of shopping at stores or going to malls. Amazon soared to even higher heights, Walmart upped their game, Etsy brought the artsy, and thousands of Shopify sites delivered the goods. Speaking of delivery, the empty city streets became home to fleets FedEx, Amazon, UPS, and DHL trucks bringing packages to your front doorstep. Many retail employees traded-in working at customer-facing stores for working in a distribution centers as long as they could outperform robots. Even though people are looking forward to hanging out at malls in 2021, the e-commerce, distribution center, delivery truck trinity is here to stay. This ball was already in motion and got a rocket boost from COVID. This market will stay hot in the first half of 2021 and then cool a bit in the second half.

Ghost Kitchens

The COVID pandemic really took a toll on restaurants in the 2020, with many of them going out of business permanently. Those that survived had to pivot to digital and other ways of doing business. High-end steakhouses started making burgers on grills in the parking lot, while takeout pizzerias discovered they finally had the best business model. Having a drive-thru lane was definitely one of the keys to success in a world without waiters, busboys, and hosts. “Front of house” was shut down, but the “back of house” still had a pulse. Adding mobile web and native apps that allowed customers to easily order from operating “ghost kitchens” and pay with credit cards or Apple/Google/Samsung Pay enabled many restaurants to survive. A combination of curbside pickup and delivery from the likes of DoorDash, Uber Eats, Postmates, Instacart and Grubhub made this business model work. A surge in digital marketing also took place where many restaurants learned the importance of maintaining a relationship with their loyal customers via connected mobile devices. For the most part, 2021 has restauranteurs hoping for 100% in-person dining, but a new business model that looks a lot like catering + digital + physical delivery is something that has legs.

The Internet of Things

At its very essence, IoT is all about remotely knowing the state of a device or environmental system along with being able to remotely control some of those machines. COVID forced people to work, learn, and meet remotely and this same trend applied to the industrial world. The need to remotely operate industrial equipment or an entire “lights out” factory became an urgent imperative in order to keep workers safe. This is yet another case where the pandemic dramatically accelerated digital transformation. Connecting everything via APIs, modeling entities as digital twins, and having software bots bring everything to life with analytics has become an ROI game-changer for companies trying to survive in a free-falling economy. Despite massive employee layoffs and furloughs, jobs and tasks still have to be accomplished, and business leaders will look to IoT-fueled automation to keep their companies running and drive economic gains in 2021.

Streaming Entertainment

Closed movie theaters, football stadiums, bowling alleys, and other sources of entertainment left most people sitting at home watching TV in 2020. This turned into a dream come true for streaming entertainment companies like Netflix, Apple TV+, Disney+, HBO Max, Hulu, Amazon Prime Video, Youtube TV, and others. That said, Quibi and Facebook Watch didn’t make it. The idea of binge-watching shows during the weekend turned into binge-watching every season of every show almost every day. Delivering all these streams over the Internet via apps has made it easy to get hooked. Multiplayer video games fall in this category as well and represent an even larger market than the film industry. Gamers socially distanced as they played each other from their locked-down homes. The rise of cloud gaming combined with the rollout of low-latency 5G and Edge computing will give gamers true mobility in 2021. On the other hand, the video streaming market has too many players and looks ripe for consolidation in 2021 as people escape the living room once the vaccine is broadly deployed.

Healthcare

With doctors and nurses working around the clock as hospitals and clinics were stretched to the limit, it became increasingly difficult for non-COVID patients to receive the healthcare they needed. This unfortunate situation gave tele-medicine the shot in the arm (no pun intended) it needed. The combination of healthcare professionals delivering healthcare digitally over widespread connectivity helped those in need. This was especially important in rural areas that lacked the healthcare capacity of cities. Concurrently, the Internet of Things is making deeper inroads into delivering the health of a person to healthcare professionals via wearable technology. Connected healthcare has a bright future that will accelerate in 2021 as high-bandwidth 5G provides coverage to more of the population to facilitate virtual visits to the doctor from anywhere.

Working and Living

As companies and governments told their employees to work from home, it gave people time to rethink their living and working situation. Lots of people living in previously hip, urban, high-rise buildings found themselves residing in not-so-cool, hollowed-out ghost towns comprised of boarded-up windows and closed bars and cafés. Others began to question why they were living in areas with expensive real estate and high taxes when they not longer had to be close to the office. This led to a 2020 COVID exodus out of pricey apartments/condos downtown to cheaper homes in distant suburbs as well as the move from pricey areas like Silicon Valley to cheaper destinations like Texas. Since you were stuck in your home, having a larger house with a home office, fast broadband, and a back yard became the most important thing. Looking ahead to 2021, a hybrid model of work-from-home plus occasionally going into the office is here to stay as employees will no longer tolerate sitting in traffic two hours a day just to sit in a cubicle in a skyscraper. The digital transformation of how and where we work has truly accelerated.

Data and Advanced Analytics

Data has shown itself to be one of the world’s most important assets during the time of COVID. Petabytes of data has continuously streamed-in from all over the world letting us know the number of cases, the growth or decline of infections, hospitalizations, contact-tracing, free ICU beds, temperature checks, deaths, and hotspots of infection. Some of this data has been reported manually while lots of other sources are fully automated from machines. Capturing, storing, organizing, modeling and analyzing this big data has elevated the importance of cloud and edge computing, global-scale databases, advanced analytics software, and the growing importance of machine learning. This is a trend that was already taking place in business and now has a giant spotlight on it due to its global importance. There’s no stopping the data + advanced analytics juggernaut in 2021 and beyond.

Conclusion

2020 was one of the worst years in human history and the loss of life was just heartbreaking. People, businesses, and our education system had to become resourceful to survive. This resourcefulness amplified the importance of delivering connected, digital experiences to make previously remote things into local ones. Cheers to 2021 and the hope for a brighter day for all of humanity.

Read more…

By Michele Pelino

The COVID-19 pandemic drove businesses and employees to became more reliant on technology for both professional and personal purposes. In 2021, demand for new internet-of-things (IoT) applications, technologies, and solutions will be driven by connected healthcare, smart offices, remote asset monitoring, and location services, all powered by a growing diversity of networking technologies.

In 2021, we predict that:

  • Network connectivity chaos will reign. Technology leaders will be inundated by an array of wireless connectivity options. Forrester expects that implementation of 5G and Wi-Fi technologies will decline from 2020 levels as organizations sort through market chaos. For long-distance connectivity, low-earth-orbit satellites now provide a complementary option, with more than 400 Starlink satellites delivering satellite connectivity today. We expect interest in satellite and other lower-power networking technologies to increase by 20% in the coming year.
  • Connected device makers will double down on healthcare use cases. Many people stayed at home in 2020, leaving chronic conditions unmanaged, cancers undetected, and preventable conditions unnoticed. In 2021, proactive engagement using wearables and sensors to detect patients’ health at home will surge. Consumer interest in digital health devices will accelerate as individuals appreciate the convenience of at-home monitoring, insight into their health, and the reduced cost of connected health devices.
  • Smart office initiatives will drive employee-experience transformation. In 2021, some firms will ditch expensive corporate real estate driven by the COVID-19 crisis. However, we expect at least 80% of firms to develop comprehensive on-premises return-to-work office strategies that include IoT applications to enhance employee safety and improve resource efficiency such as smart lighting, energy and environmental monitoring, or sensor-enabled space utilization and activity monitoring in high traffic areas.*
  • The near ubiquity of connected machines will finally disrupt traditional business. Manufacturers, distributors, utilities, and pharma firms switched to remote operations in 2020 and began connecting previously disconnected assets. This connected-asset approach increased reliance on remote experts to address repairs without protracted downtime and expensive travel. In 2021, field service firms and industrial OEMs will rush to keep up with customer demand for more connected assets and machines.
  • Consumer and employee location data will be core to convenience. The COVID-19 pandemic elevated the importance location plays in delivering convenient customer and employee experiences. In 2021, brands must utilize location to generate convenience for consumers or employees with virtual queues, curbside pickup, and checking in for reservations. They will depend on technology partners to help use location data, as well as a third-party source of location trusted and controlled by consumers.

* Proactive firms, including Atea, have extended IoT investments to enhance employee experience and productivity by enabling employees to access a mobile app that uses data collected from light-fixture sensors to locate open desks and conference rooms. Employees can modify light and temperature settings according to personal preferences, and the system adjusts light color and intensity to better align with employees’ circadian rhythms to aid in concentration and energy levels. See the Forrester report “Rethink Your Smart Office Strategy.”

Originally posted HERE.

Read more…

By: Kiva Allgood, Head of IoT for Ericsson

Recently, I had the pleasure of participating in PTC’s LiveWorx conference as it went virtual, adding further credence to its reputation as the definitive event for digital transformation. I joined PTC’s Chief Technology Officer Steve Dertien for a presentation on how to unleash the power of industrial IoT (IIoT) and cellular connectivity.

A lot has changed in business over the past few months. With a massive remote migration the foremost priority, many business initiatives were put on the back burner. IIoT wasn’t one of them. The realm has remained a key strategic objective; in fact, considering how it can close distances and extend what industrial enterprises are able to monitor, control and accomplish, it’s more important than ever.

Ericsson and PTC formed a partnership specifically to help industrial enterprises accelerate digital transformation. Ericsson unlocks the full value of global cellular IoT connectivity and provides on-premise solutions. PTC offers an industrial IoT platform, ready to configure and deploy, with flexible connectivity and capabilities to build IoT solutions without manual coding.

This can enable enterprises to speed up cellular IoT deployments, realize the advantages of Industry 4.0 and better compete. Further, they can create a foundation for 5G, introducing such future benefits as network slicing, edge computing and high reliability, low-latency communications.

It all sounds great, I know, but if you’re like most folks, you probably have a few basic questions on your mind. Here’s are a few of the ones that I typically receive and appreciate the most.

Why cellular?

You’re connected already, via wire or Wi-Fi, so why is cellular necessary? You need reliable, global and dedicated connectivity that’s flexible to deploy. If you think about a product and its lifecycle, it may be manufactured in one location, land in another, then ultimately move again. If you can gather secure insight from it – regardless of where it was manufactured, bought or sold – you can improve operational efficiency, product capabilities, identify new business opportunities and much more.

What cellular can do especially well is effectively capture all that value by combining global connectivity with a private network. Then, through software like PTC’s, you can glean an array of information that’ll leave you wondering how else you can use the technology, regardless of whether the data is on or off the manufacturing floor. For instance, by applying virtual or augmented reality (VR/AR), you can find product defects before they leave the factory or end up in other products.

That alone can eliminate waste, save money from production to shipping, protect your reputation and much more.

According to analysts at ABI Research, we’ll see 4.3 billion wireless connections in smart factories by 2030, leading to a $1 trillion smart manufacturing market. For those that embrace Industry 4.0, private cellular has the potential to improve gross margins by 5-13% for factory and warehouse operations. What’s more, manufacturers can expect a 10x return on their investment.

You just need to be able to reliably turn actionable intelligence throughout the product’s lifecycle and across your global enterprise both securely and reliably – and that’s what cellular delivers.

Where do I start?

People don’t often ask for cellular or a dedicated private network specifically. They come to us with questions about things like how they can improve production cycle times or reduce costs by a certain percentage. That’s exactly where you should begin, too.

I come from the manufacturing space where for years I lived quality control, throughput and output. When someone would introduce a new idea, we’d vet it with a powerful but simple question: How will this make or save us money? If it couldn’t do either, we weren’t interested.

Look at your products and processes the same way when it comes to venturing into IIoT and digital transformation. Find the pain points. Identify defects, bottlenecks and possible improvements. Seek out how to further connect your business and the opportunities that could present. Data is indeed the new oil; it’s the intelligence that’ll help you understand where you need to go and what you need to do to move forward or create a new business.

What should I look for?

To get off on the right foot, be sure to engage the right partners. Realize this is a very complex area; no single provider can offer a solution that’ll address every need in one. You need partners with an ecosystem of their own best-of-breed partners; that’s why we work with companies like PTC. We have expertise in specific areas, focus on what we do best and work closely together to ensure we approach IIoT right.

We are building on an established foundation we created together. Both organizations have invested a lot of time, money, R&D cycles and processes in developing our individual and collective offerings. That said, not only will we be working together into the future, customers are assured they’ll remain on the forefront of innovation.

That future proofing is what you need to look for as well. You need wireless connectivity for applications involving asset tracking, predictive maintenance, digital twins, human-robot workflow integration and more. While Industry 4.0 is a priority, you want to lay a foundation for fast adoption of 5G, too.

There are other considerations to keep in mind down the road, such as your workforce. Employees may not want to be “machines” themselves, but they will want to be a robotics engineer or use AR or VR for artificial intelligence analysis. The future of work is changing, too, and IIoT offers a way to keep employees engaged.

Originally posted HERE

CLICK HERE to view Kivsa Allgood's LiveWorx presentation, “Unleashing the Power of Industrial IoT and Cellular Connectivity.”

Read more…
RSS
Email me when there are new items in this category –

Sponsor