Guest blog post by Cameron Turner

Executive Summary
Though often the focus of the urban noise debate, Caltrain is one of many contributors to overall sound levels along the Bay Area’s peninsula corridor. In this investigation, Cameron Turner of Palo Alto’s The Data Guild takes a look at this topic using a custom-built Internet of Things (IoT) sensor atop the Helium networking platform.
Introduction
If you live in (or visit) the Bay Area, chances are you have experience with the Caltrain. Caltrain is a commuter line which travels 77.4 miles between San Francisco and San Jose , carrying over 50 thousand passengers on over 70 trains daily.[1]
I’m lucky to live two blocks from the Caltrain line, and enjoy the convenience of the train. My office, The Data Guild, is just one block away. The Caltrain and its rhythms, bells and horns are a part of our daily life, and connect us to the City and with connections to BART, Amtrak, SFO and SJC, the rest of the world.
Over the holidays, my 4-year-old daughter and I undertook a project to quantify the Caltrain through a custom-built sensor and reporting framework, to get some first-hand experience in the so-called Internet of Things (IoT). This project also aligns with The Data Guild’s broader ambition to build out custom sensor systems atop network technologies to address global issues. (More on this here.)
Let me note here that this project was an exploration, and was not conducted in a manner (in goals or methodology) to provide fodder for either side of the many ongoing caltrain debates: the electrification project, quiet zone, or tragic recent deaths on the tracks.
Background
My interest in such a project began with an article published in the Palo Alto Daily in October 2014. The article addressed the call for a quiet zone in downtown Palo Alto, following complaints from residents of buildings closest to the tracks. Many subjective frustrations were made by residents based on personal experience.
According the the Federal Railroad Administration (FRA), the rules by which Caltrain operates, train engineers “must begin to sound train horns at least 15 seconds, and no more than 20 seconds, in advance of all public grade crossings.”
Additionally: “Train horns must be sounded in a standardized pattern of 2 long, 1 short and 1 long blasts.” and “The maximum volume level for the train horn is 110 decibels which is a new requirement. The minimum sound level remains 96 decibels.“
Questions
Given the numeric nature of the rules, and the subjective nature of current analysis/discussion, it seemed an ideal problem to address with data. Some of the questions we hoped to address including and beyond this issue:
- Timing: Are train horns sounded at the appropriate time?
- Schedule: Are Caltrains coming and going on time?
- Volume: Are the Caltrain horns sounding at the appropriate level?
- Relativity: How do Caltrain horns contribute to overall urban noise levels?
Methodology
Our methodology to address these topics included several steps:
- Build a custom sensor equipped to capture ambient noise levels
- Leverage an uplink capability to receive data from the sensor in near real-time
- Deploy sensor then monitor sensor output and test/modify as needed
- Develop a crude statistical model to convert sensor levels (voltage) to sound levels (dB)
- Analysis and reporting
Apparatus
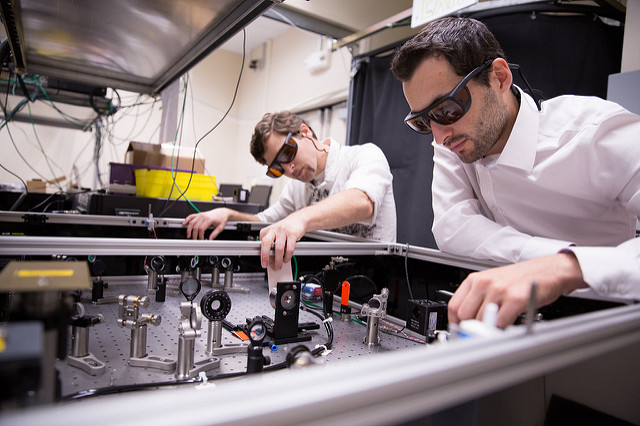
We developed a simple sensor based on the Arduino platform. A baseline Uno board, equipped with a local ATmega328 processor, was wired to and Adafruit Electret Microphone/Amplifier 4466 w/adjustable gain.
We were lucky to be introduced through the O’Reilly Strata NY event to a local company: Helium. Backed by Khosla Ventures et al, Helium is building an internet of things platform for smart machines. They combine a wireless protocol optimized for device and sensor data with cloud-based tooling for working with the data and building applications.
We received a Beta Kit which included a Arduino shield for uplink to their bridge device, which then connects via GSM to the Internet. Here is our sensor (left) with the Helium bridge device (right).

Deployment
With our instrument ready for deployment, we sought to find a safe location to deploy. By good fortune, a family friend (and member of the staff of the Stanford Statistics department, where I am completing my degree) owns a home immediately adjacent to a Caltrain crossing, where Caltrain operators are required to sound their horn.

Conductors might also be particularly sensitive to this crossing, Churchill St., due to its proximity to Palo Alto High School and the tragic train-related death of a teen, recently.
From a data standpoint, this location was ideal as it sits approximately half-way between the Palo Alto and California Avenue stations.
We deployed our sensor outdoors facing the track in a waterproof enclosure and watched the first data arrive.
Monitoring
Through a connector to Helium’s fusion platform, we were able to see data in near real-time. (note the “debug” window on the right, where microphone output level arrives each second).

We used another great service, provided by Librato, (now a part of SolarWinds) a San Francisco-based monitoring and metrics company. Using Librato, we enabled data visualization of the sound levels as they were generated. We were able to view this relative to its history. This was a powerful capability as we worked to fine-tune the power and amplifier.

Note the spike in the middle of the image above, which we could map to a train horn heard ourselves during the training period.
Data Preparation
Next, we took a weekday (January 7, 2015), which appeared typical of a non-holiday weekday relative to the entire month of data collected. For this period, we were able to construct a 24-hour data set at 1-second sample intervals for our analysis.
Data was accessed through the Librato API, downloaded as JSON, converted to CSV and cleansed.
Analysis
First, to gain intuition, we took a sample recording gathered at the sensor site of a typical train horn.
Click HERE to hear the sample sound.
Using matplotlib within an ipython notebook, we are able to “see” this sound, in both its raw audio form and as a spectrogram showing frequency:

Next, we look at our entire 24 hours of data, beginning on the evening of January 6, and concluding 24 hours later on the evening of January 7th. Note the quiet “overnight” period, about a quarter of the way across the x axis.

To put this into context, we overlay the Caltrain schedule. Given the sensor sits between the Palo Alto and California Avenue stations, and given the variance in stop times, we mark northbound trains using the scheduled stop at Palo Alto (red), and southbound trains using the scheduled stop at California Ave (green).

Initially, we can make two converse observations: many peak sound events tend to lie quite close to these stop times, as expected. However: many of the sound events (including the maximum recorded value, the nightly ~11pm freight train service) occur independent of the scheduled Caltrains.
Conversion to Decibels
On the Y axis above, the sound level is reported in the raw voltage output from the Microphone. To address the questions above we needed a way to convert these values to decibel units (dB).
To do so, a low-cost sound meter was obtained from Fry’s. Then an on-site calibration was performed to map decibel readings from the sensor to the voltage output uploaded from our microphone.

Within R Studio, these values were plotted and a crude estimation function was derived to create a linear mapping between voltage and dB:


The goal of doing a straight line estimate vs. log-linear was to compensate for differences in apparatus (dB meter vs. microphone within casing) and overall to maintain conservative approximations. Most of the events in question during the observation period were between 2.0 and 2.5 volts, where we collected several training points (above).
A challenge in this process was the slight lag between readings and data collection with unknown variance. As such, only “peak” and “trough” measurements could be used reliably to build the model.
With this crude conversion estimator in hand, we would now replot the data above with decibels on the y axis.

Clearly the “peaks” above are of interest as outliers from the baseline noise level at this site. In fact, there are 69 peaks (>82 dB) observed (at 1-second sample rate), and 71 scheduled trains for this same period. Though this location was about 100 yards removed from the tracks, the horns are quieter than the recommended 96dB-115dB range recommended by the FRA. (With caveat above re: crude approximator)
Interesting also that we’re not observing the “two long-two short-one long” pattern. Though some events are lost to the sampling rate, qualitatively this does not seem to be a standard practice followed by the engineers. Those who live in Palo Alto also know this to be true, qualitatively.
Also worth noting is the high variance of ambient noise, the central horizontal blue “cloud” above, ranging from ~45 dB to ~75 dB. We sought to understand the nature of this variance and whether it contained structure.
Looking more closely at just a few minutes of data during the Jan 7 morning commute, we can see that indeed there is a periodic structure to the variance.

In comparing to on-site observations, we could determine that this period was defined by the traffic signal which sits between the sensor and the train tracks, on Alma St. Additionally, we often observe an “M” structure (bimodal peak) indicating the southbound traffic accelerating from the stop line when the light turned green, followed by the passing northbound traffic seconds later.
Looking at a few minutes of the same morning commute, we can clearly see when the train passed and sounded its horn. Here again, green indicates a southbound train, red indicates and northbound train.

In this case, the southbound train passed slightly before its scheduled arrival time at the California Avenue station, and the Northbound train passed within its scheduled arrival minute, both on time. Note also the peak unassociated with the train. We’ll discuss this next.
Perhaps a more useful summary of the data collected is shown as a histogram, where the decibels are shown on the X axis and the frequency (count) is shown on the Y axis.

We can clearly see a bimodal distribution, where sound is roughly normally distributed, with a second distribution at the higher end. The question still remained why several of the peak observed values fell nowhere near the scheduled train time?
The answer here requires no sensors: airplanes, sirens and freight trains are frequent noise sources in Palo Alto. These factors, coupled with a nearby residential construction project accounted for the non-regular noise events we observed.
Click HERE to hear a sample sound.
Finally, we subsetted the data into three groups, one to look at non-Train minutes, one to look at northbound train minutes and one to look at southbound train minutes. The mean dB levels were 52.13, 52.18 and 52.32 respectively. While the order here makes sense, these samples bury the outcome since a horn blast may only be one second of a train-minute. The difference between northbound and southbound are consistent with on-site observation-- given the sensor lies on the northeast corner of the crossing, horn blasts from southbound trains were more pronounced.
Conclusion
Before making any conclusions it should be noted again that these are not scientific findings, but rather an attempt to add some rigor to the discussion around Caltrain and noise pollution. Further study with a longer period of analysis and duplicity of data collection would be required to statistically state these conclusions.
That said, we can readdress the topics in question:
Timing: Are train horns sounded at the appropriate time?
The FRA recommends engineers sound their horn between 15 and 20 seconds before a crossing. Given the tight urban nature of this crossing this recommendation seems a misfit. Caltrain engineers are sounding within 2-3 seconds of the crossing, which seems more appropriate.
Schedule: Are Caltrains coming and going on time?
Though not explored in depth here, generally we can observe that trains are passing our sensor prior to their scheduled arrival at the upcoming station.
Volume: Are the Caltrain horns sounding at the appropriate level?
As discussed above, the apparent dB level at a location very close to the track was well below the FRA recommended levels.
Relativity: How do Caltrain horns contribute to overall urban noise levels?
The Caltrain horns generate roughly an additional 10dB to peak baseline noise levels, including period traffic events at the intersection observed.
Opinions
Due to their regular frequency and physical presence, trains are an easy target when it comes to urban sound attenuation efforts. However, the regular oscillations of traffic, sirens, airplanes and construction create a very high, if not predictable baseline above which trains must be heard.
Considering the importance of safety to this system, which operates just inches from bikers, drivers and pedestrians, there is a tradeoff to be made between supporting quiet zone initiatives and the capability of speeding trains to be heard.
In Palo Alto, as we move into an era of electric cars, improved bike systems and increased pedestrian access, the oscillations of noise created by non-train activities may indeed subside over time. And this in turn, might provide an opportunity to lower the “alert sounds” such as sirens and train horns required to deliver these services safely. Someday much of our everyday activity might be accomplished quietly.
Until then, we can only appreciate these sounds which must rise above our noisy baseline, as a reminder of our connectedness to the greater bay area through our shared focus on safety and convenient public transportation.
…
Acknowledgements:
Sincere thanks to Helen T. and Nick Parlante of Stanford University, Mark Phillips of Helium and Nik Wekwerth/Jason Derrett/Peter Haggerty of Librato for their help and technical support.
Thanks also to my peers at The Data Guild, Aman, Chris, Dave and Sandy and the Palo Alto Police IT department for their feedback.
And thanks to my daughter Tallulah for her help soldering and moral support.
[1] http://en.wikipedia.org/wiki/Caltrain
Originally posted on LinkedIn.
Follow us @IoTCtrl | Join our Community


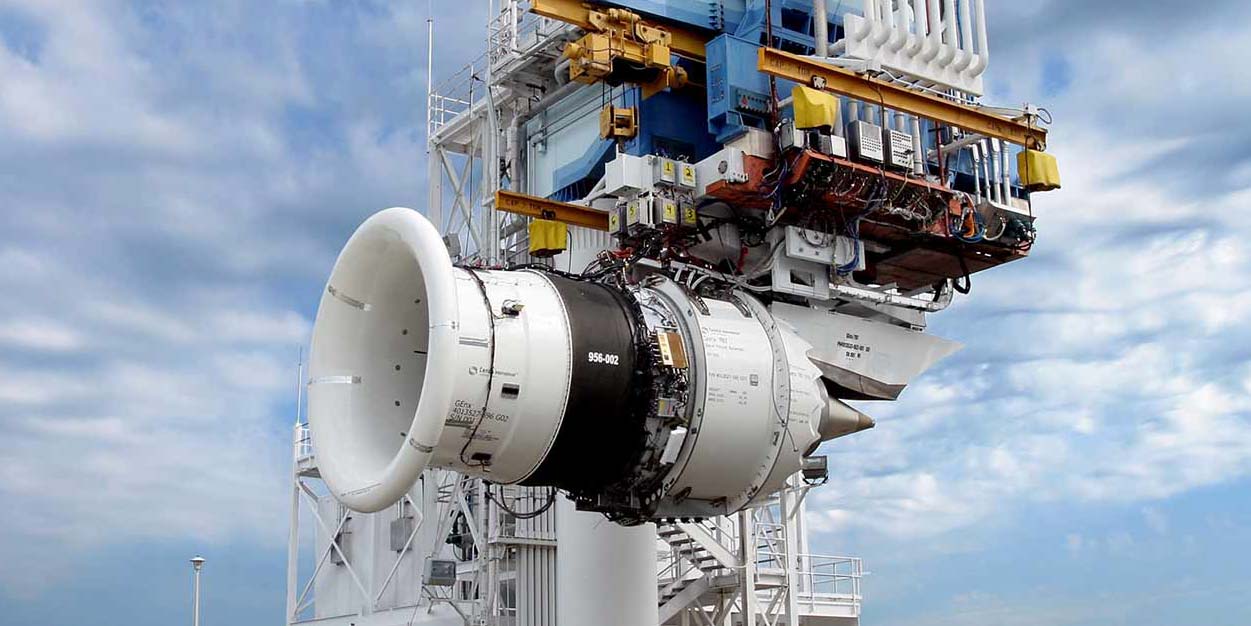 Here’s a timely new case study from MIT Sloan Management Review that looks at how GE is seeking opportunities in the Internet of Things with industrial analytics. GE is leading the development of a new breed of operational technology (OT) that literally sits on top of industrial machinery. Long known as the technology that controls and monitors machines, OT now goes beyond these functions by connecting machines via the cloud and using data analytics to help predict breakdowns and assess the machines’ overall health. I’m really glad to see someone dive into this as I think GE’s