All Posts (1131)
Sort by
Internet of Nano Things (IoNT) infrastructure can be deployed as a combination of various nanotechnologies and nano devices. The IoNT infrastructure depends on the area of operation and required bandwidth for a particular application. Deployment of IoNT infrastructure provides high speed of communication and reduces the bandwidth pressure on existing communication infrastructure. The growth of the Internet of Nano Things (IoNT) primarily focuses on improving processing capabilities, providing larger storage capacity at lower costs and increasing the role of communication terminals. The IoNT infrastructure can be deployed in various eco-systems such as electro-magnetic waves, Wi-Fi, Li-Fi, radio frequency identification (RFID) and nano antenna.
One of the major factors driving the growth of IoNT market is the rise of ubiquitous connectivity. With the increasing number of computer devices and interconnection capabilities over the internet, various industrial applications of IoNT have been identified. The interconnection of nano devices has enabled efficient communication of data between different devices or components of a system. Thus, through IoNT, organizations are able to reduce the complexity in communication and increase the efficiency of processes using such connected devices. Moreover, government’s support for the development of IoNT technology for healthcare has further increased the demand and awareness of IoNT. However, the growth of the IoNT market faces a few challenges due to privacy and security issues. Since critical data is communicated between devices over the internet, concerns related to security of the data have risen. Another factor which hinders the growth of IoNT market is the huge capital investment required for the development of nanotechnology.
Immense growth opportunities of the IoNT market have been identified through its applications in various sectors such as healthcare, transportation, logistics, manufacturing, media, entertainment and retail. With technological advancements in the IoNT, the scope of IoNT and its applications is on the rise. Major companies are conducting research on nanotechnology and constantly developing nano systems with wider scope of applications. Some of the major players in the IoNT market are Intel Corporation, Cisco Systems Inc., Qualcomm Incorporated, Juniper Networks and IBM Corporation in U.S., Schneider Electric and Alcatel-Lucent S.A. in France, and SAP S.E. and Siemens AG in Germany among others.
This research report analyzes this market on the basis of its market segments, major geographies, and current market trends. Geographies analyzed under this research report include
- North America
- Asia Pacific
- Europe
- Rest of the World
This report provides comprehensive analysis of
- Market growth drivers
- Factors limiting market growth
- Current market trends
- Market structure
- Market projections for upcoming years
This report is a complete study of current trends in the market, industry growth drivers, and restraints. It provides market projections for the coming years. It includes analysis of recent developments in technology, Porter’s five force model analysis and detailed profiles of top industry players. The report also includes a review of micro and macro factors essential for the existing market players and new entrants along with detailed value chain analysis.
The report can be seen here.
Originally posted on Data Science Central
Follow us @IoTCtrl | Join our Community
Guest blog post by Bernard Marr
I have to admit, I love the swell of Internet of Things devices and technology we’re seeing right now.
Smart alarm clocks that can wake you without waking your bedmate, smart showers that help you save water, a smart kettle or coffee pot you can start with your phone, a smart frying pan to alert you before you burn the eggs — and that’s all before breakfast.
Some IoT devices seem silly while others seem poised to help change the world. But the one thing they all have in common is that they aren’t really about the things themselves.
Source for picture: click here (2014 Gartner chart)
The Internet of Things is really all about data.
Big data is all about data, while the Internet of things involves data, devices, and connectivity, but in the end, they tend to come down to the same thing.
And while many companies are jumping on the IoT bandwagon — from big providers like Cisco and Dell all the way down to Kickstarter-funded startups — they’re all going to have to watch their data if they want to succeed.
I have three main suggestions for companies looking to benefit from the data their smart devices, sensors, and RFID tags gather:
- Ensure your data is accurate. As IoT devices reach consumers, the must become less expensive to produce and maintain. This could result in a loss of accuracy. For example, if you wear three different types of fitness monitors during a workout, you’re likely to get three different measurements of how many calories you’ve burned. At an individual level, the accuracy probably doesn’t matter that much — it won’t make a huge difference to me if I’ve burned 400 calories or 337 calories — but on a larger scale, it could make a huge difference, depending on what the company wants to learn from the data. Building a strategy on inaccurate data will not yield good results.
- Protect your data chain. Because people are only just beginning to think of data as a business resource, they are also only just beginning to think of protecting that resource. Any erroneous or altered data streams could affect the accuracy of the dataset on the whole. So far, security at the sensor level is the most difficult to achieve and maintain, but without a secure data chain, you can’t rely on accurate data.
- Collect the right data (and ask the right questions). As with all big data projects, data itself is useless without the right questions driving it. IoT data must have the right kinds of analysis projects behind it to make it useful for any business. You can know every movement of every shipment you ever send, but unless you can use that data to improve your processes, it is useless — expensive, and useless. IoT data collection has to be backed up by solid data analysis to be useful, and the business units need to be involved in dictating what data is collected and what analyses are performed.
So, while it is awfully cool to have a smart yoga mat to help you improve your poses, or a smart refrigerator so you don’t forget the milk, the IoT trend won’t go very far just for being clever or cool. But when the businesses behind those cool toys put the data they collect to work, they may find that the Internet of Things is real business.
How do you feel about the Internet of Things and smart devices? Cool or creepy? Business boom or bust? I’d love to hear your opinions in the comments below.
Follow us @IoTCtrl | Join our Community
While many of us recognize that companies are empowered by actionable information penetrations and help drive sales, devotion and superior customer experiences, the thought of making sense of enormous quantities of information and undertaking the task of unifying is daunting. But that is slowly changing. Experts forecast that this year, budgets will be allocated by most companies, and that 2015 will undoubtedly be the year of big data and discover the best tools and resources to really harness their data.
Information gathering has developed radically, and both C-level executives as well as their teams now recognize they have to join the data arms race that was big to keep and grow their customer base, also to stay competitive in today's data-driven marketplace. Terms like in-memory databases, sensor information, customer data platforms and predictive analytics will end up more widely understood.
With terabytes of information being gathered by companies at multiple touchpoints, platforms, devices and offline places, companies will start to focus more on possessing their info, to be able to access, visualize and control this data, and on monetizing their audience in real-time together with the right content. More emphasis will likely be placed on ethically info is accumulated, how clean and collect the big data is and to be an information hoarder that accumulates information you don't really want.
Here are the top 5 information trends that we predict will reign 2015:
1. Data agility will take center stage
It's not sufficient to just own quantities of customer information if this info is not agile. More companies are seeking approaches that are simple, quick and easy to offer unified and protected use of customer information, across departments and systems. CMOs, CTOs, information scientists, business analysts, programmers and sales teams possess precisely the same pressing need for tools and training to assist them navigate their customer data. With the growing popularity of wearables, sensors and IoT apparatus, there's additional real time information flooding in. Plus having customer information saved on multiple legacy platforms and third party vendor systems only makes information agility that much more challenging. Most firms only use about 12.5% of their available data to grow their company. Having access to the proper tools which make customer information more agile and easy to use is going to be a significant focus of businesses in 2015.
2. Information is the New Gold & Puts Businesses In Control
For several businesses, the most commonly-faced information need is ownership and unification: Volumes of information being generated every second, being saved on multiple legacy platforms that still use dated structure, as well as the inability to access all this customer data in a single area to get a "complete view" of their customers. But together with technology that makes information union easier and the introduction of new tools, businesses are beginning to appreciate the worth of controlling and possessing their customer data. The frustrations of working with multiple third party sellers to gain possession of information, along with a lack of information rights keys that permits you to automatically pull information from these vendors will be major pain points which is handled. Companies can now select from a variety of systems like Umbel to help gather first-party customer information from multiple online and offline sources, platforms and sellers, possess and unify the data, and make use of the information in real-time to power and optimize marketing and sales efforts.
3. The Rise of Customer Information Platforms
While DMPs and CRMs help fulfill many business needs, today's marketers want a centralized customer information platform like Umbel that examines and gives profound penetrations on their customer base to them. Very few businesses really have one genuinely complete, unified customer database alternative. They're largely still using multiple systems and platforms that collect information separately.
A CMO's top priority will probably be to possess a reliable Customer Info Platform that collects exact customer information from all online and offline touch points (enclosed web site visits and purchases, social interactions, beacon info, cellular and in store interactions etc.), removes duplicates and appends it with added data (demographic, geographic, behavioral, brand kinship) from other trusted sources.
4. Info Democratization Across Departments
The abundance of customer data offered to brands today is staggering and yet many companies are yet to fully use the information to supercharge marketing and sales efforts. Among the biggest hurdles that marketers face is the fact that accessibility for this information is quite limited at most firms. Primarily, only larger companies with IT resources had the capacity to gather, save, analyze, and monetize this information that is precious. Second even if data, the IT department was collecting and/or the business enterprise analytics teams have restricted access to this information and sales and marketing teams that actually use this data must undergo a convoluted, time-consuming procedure to get insights and the data they need.
With new tools like Umbel, teams don't desire an Information Scientist to make sense of their data.
For info to be genuinely valuable to an organization, it is critical that the info be democratized across teams and departments, empowering all employees, irrespective of their specialized expertise, to get information and make more informed decisions. In 2015 more companies will start to use automated platforms that enable anyone in the organization to see, assess and take actions according to customer data.
5. Mobile Data and Strategy Will End Up Vital to Advertising
Based on eMarketer, mobile search ad spend in the U.S. grew 120.8% in 2013 (overall gain of 122.0% for all mobile advertisements). Meanwhile, desktop advertisement spending went up by just 2.3% last year. The mobile program has become as useful as an essential component of any marketing plan, and sites for retailers. For companies to remain competitive, a seamless, secure, fast and instinctive experience on mobile devices, and also the ability to capture this information that is mobile and add it to a unified customer data base is critical. Having this unified information of customers from every touchpoint (including cellular and offline) will enable firms to identify trends and shape a better customer experience. More companies are getting to be conscious of how significant it is to be able to unify their information and compare analytics across all platforms to help them create personalised marketing campaigns centered on a "complete customer view."
Originally posted on Data Science Central
Follow us @IoTCtrl | Join our Community
Guest blog and great infographic from Matt Zajechowski
It’s no secret that analytics are everywhere. We can now measure everything, from exabytes of organizational “big data” to smaller, personal information like your heart rate during a run. And when this data is collected, deciphered, and used to create actionable items, the possibilities, both for businesses and individuals, are virtually endless.
One area tailor-made for analytics is the sports industry. In a world where phrases like “America’s pastime” are thrown around and “the will to win” is revered as an intangible you can’t put a number on, stats lovers with PhDs in analytics are becoming more and more essential to sports franchises. Since the sabermetric revolution, sports franchises have begun investing time and money in using sports analytics from wearable technology to help their athletes train and even make more money from their stadiums.
Today, Sports Fans Prefer the Couch Over the Stadium
For decades, television networks have tried to create an at-home experience that’s on par with the stadium experience — and they’ve succeeded emphatically. In a 1998 ESPN poll, 54% of sports fans reported that they would rather be at the game than watch it at home; however, when that same poll was readministered in 2011 found that only 29% preferred being at the game.
While this varies by sport to some degree, the conclusion is clear: people would rather watch a game in the comfort of their own climate-controlled homes, with easy access to the fridge and a clean bathroom, than experience the atmosphere of the stadium in person. Plus, sports fans today want the ability to watch multiple games at once; it’s not unusual for diehard fans to have two televisions set up with different games on, plus another game streaming on a tablet.
However, fans could be persuaded to make their way back to the stadiums; 45% of “premium fans” (who always or often buy season tickets) would pay more money for a better in-person experience. That’s where wearable technology comes into play.
Wearable Data — for Fans Too
At first glance, the sole application of wearable technology and data science should seemingly be to monitor and improve athlete performance. These tasks might include measuring heart rate and yards run, timing reactions and hand speed, gauging shot arch, and more, while also monitoring the body for signs of concussion or fatigue
And that’s largely true. For example, every NBA arena now uses SportVU, a series of indoor GPS technology-enabled cameras, to track the movements of the ball and all players on the court at a rate of 25 times per second. With that data, they can use myriad statistics concerning speed, distance, player separation, and ball possession to decide when to rest players.
Similarly, Adidas’ Micoach is used by the German national soccer team during training to monitor speed, running distances, and heart rates of each player. In fact, this system is credited with the decision to sub in German soccer player Mario Gotze in the 88th minute of the 2014 World Cup final; in the 113th minute, the midfielder scored the World Cup-winning goal.
However, some sports franchises are using that wearable technology to benefit the fan sitting in the stadium. For example, the Cleveland Cavaliers’ Quicken Loans Arena (an older stadium) was retrofitted with SportsVU; however, they don’t use them just for determining when LeBron James needs a break. Instead, the Cavs use the data tracked by SportsVU to populate their Humungotron with unique statistics tracked in real-time during the game. The Cavs then took this data to the next level by using the stats in their social media marketing and to partner with various advertisers.
How Analytics Are Improving the Stadium Experience
Besides sharing interesting statistics on the JumboTron during the game, stadiums are using data from athletes and fans to enhance the spectators’ experience. In fact, stadiums are actually mirroring the in-home experience, through various apps and amenities that reach the spectator right in their seat.
And at times, they’re going above and beyond simply imitating the in-home experience. Take the Sacramento Kings, for example. In 2014, the team partnered with Google to equip many of its courtside personnel (mascots, reporters, and even dancers) with Google Glass. Fans were able to stream close-up, first-person views of the action through their mobile devices, allowing them to feel closer than their upper-level seats would suggest.
Levi’s Stadium in Santa Clara (home of the San Francisco 49ers) boasts a fiber optic network that essentially powers every activity in their thoroughly modern stadium. The stadium contains 680 Wi-Fi access ports (one for every 100 seats in the stadium) and around 12,000 ethernet ports, allowing everything from video cameras and phones to connect to a 40 gigabit-per-second network that’s 10,000 times faster than the federal classification for broadband. 1700 wireless beacons use a version of Bluetooth to triangulate a fan’s position within the stadium and give them directions. And for fans who don’t want to leave their seats, a specially developed app can be used for tickets, food delivery to your seat, and watching replays of on-field action.
The Miami Dolphins, meanwhile, have partnered with IBM and use technology from their “Smart Cities” initiative to monitor and react to weather forecasts, parking delays, and even shortages of concessions at specific stands in Sun Life Stadium. The Dallas Cowboys’ AT&T Stadium features 2,800 video monitors throughout the stadium as well as more than five million feet of fiber optic cable, used for everything from gathering data to ordering food in-suite.
NFL teams aren’t the only franchises making use of sports analytics. The Barclays Center, home of the Brooklyn Nets, uses Vixi to display properly hashtagged tweets on multiple big screens throughout the arena. They also use AmpThink, a series of networking tools that require the user to submit some personal information before logging onto the arena’s Wi-Fi; that way, they’re able to collect data on how and where people are logging in, as well as what services they’re using while in the arena. Fans can already order food and drink from their seats and replay sequences from various camera angles, and in the future, they’ll be able to use an app that gives information about restroom waits and directions to the restrooms with the shortest lines.
To some, the increase of connectivity might seem to take away from the experience of watching a game live; after all, how can you enjoy live action if you’re constantly staring down at your phone? On the contrary: by employing these apps to judge the shortest bathroom lines or order food directly to their seats, fans are able to stay in their seat longer and watch more of the games.
While this technology certainly isn’t cheap (and will be reflected in increased ticket prices), those extra minutes of action may be worth the higher cost to some fans. Ultimately, it’s up to the fans to decide if paying more for tickets is worth the premium experience — and the time saved waiting in line.
Bringing Fans Back, One Byte at a Time
Sports teams aren’t going to lose their fans to television without a fight. And with the majority of sports franchises embracing wearable and mobile data in some form or another, it’s a natural transition for marketing departments to apply that data to the fan experience. With easy access to Wi-Fi, snacks, replays, and shorter restroom lines, sports fans can combine the atmosphere of game day with the comfort of being in their own homes.
Originally posted on Data Science Central
Follow us @IoTCtrl | Join our Community
Earlier this week Microsoft billionaire Paul Allen announced that he was teaming up with the U.S. Department of Transportation (DOT) to offer a $50 million prize to the winner of a “Smart City” competition aimed at promoting high-tech solutions to traffic snarls.
The aim is to show what is possible when communities use technology to connect transportation assets into an interactive network. The Smart City Challenge will concentrate federal resources into one medium-sized city, selected through a nationwide competition. Funding of up to $40 million in funding will go to one mid-sized city that puts forward bold, data-driven ideas to improve lives by making transportation safer, easier and more reliable. DOT will partner with Vulcan, Paul Allen’s venture arm, to offer an additional $10 million to the winning city to support infrastructure for Electric Vehicles.
Photo: Courtesy of Cisco via Flickr
February is the deadline to submit proposals for transit innovations and DOT’s experts will select five proposals as finalists. Each of the finalists will receive $100,000 in federal funding for further development, and the winner would be announced by next June. The competition is open to U.S. mid-sized cities, which is defined as cities with a 2010 census population between 200,000 and 850,000. You can see the guidelines here.
Fifty million dollars may not sound like much compared to overall spending on transportation, but for cities of this size it’s a great start for creating a smarter city.
This week’s announcement is one of many smart city competitions announced over the years, and surely there will be more to come. Cities are where the majority of people will live and by 2050 some estimates predict that as many as seven out of 10 people on Earth will live in an urban area. The continued population increases will exceed the capacity of human administrators.
Cities will have to get a whole lot smarter.
This is why you are seeing more and more contests for cities to get smarter, and for them to be more open. Witness cities like Glasgow who won the UK’s Future Cities competition, Barcelona’s Smart City ecosystem, India’s Smart City Challenge, the Obama Administration's Smart City challenge, and New York’s efforts to build a smart city.
What this means is that sensors will be woven into every aspect of daily life. By 2020, the number of thermostats, pressure gauges, accelerometers, acoustic microphones, cameras, meters and other micro-electromechanical measuring devices linked to the Internet is predicted to reach 50 billion worldwide, a number predicted by Cisco.
Think solar powered WiFi connected trash cans to let rubbish collectors know when they are full, sensors to alert public works directors of clogged sewers, traffic cameras connected to an IP network to notify engineers in a central location of mounting traffic jams, air quality sensors to monitor pollution and rooftop acoustics sensors triangulating sounds of gunshots.
These contests are a way to drive industry towards a new era of more efficient and responsive government, driven by real-time data. The role of the IOT will also drive new economic opportunity and business development, centered around the creation, analysis and intelligent use of these data feeds. The benefits are many: increased cost-savings, bolstered civic engagement, and strengthened public health and safety.
Cheers to more contests and to the winners, which will be all of us.
Further reading: Wall Street Journal Special Report: As World Crowds In, Cities Become Digital Laboratories
Guest blog post by Bill Vorhies
We spend so much time thinking about consumers that’s it’s refreshing to find applications of Big Data and advanced analytics that are not linked to selling something. Last week I wrote about Predictive Analytics role in student success in colleges. This week a friend pointed me to this very interesting article on The Role of Big Data in Medicine. This article was published by McKinsey&Company and features interviews with Dr. Eric Schadt, the founding director of the Icahn Institute for Genomics and Multiscale Biology at New York’s Mount Sinai Health System. Here are a few of the highlights.
Evolution or revolution?
The role of big data in medicine is one where we can build better health profiles and better predictive models around individual patients so that we can better diagnose and treat disease.
One of the main limitations with medicine today and in the pharmaceutical industry is our understanding of the biology of disease. Big data comes into play around aggregating more and more information around multiple scales for what constitutes a disease—from the DNA, proteins, and metabolites to cells, tissues, organs, organisms, and ecosystems. Those are the scales of the biology that we need to be modeling by integrating big data. If we do that, the models will evolve, the models will build, and they will be more predictive for given individuals.
How wearables are poised to transform medicine
Wearable devices and engagement through mobile health apps represent the future—not just of the research of diseases, but of medicine. I can be confident in saying that, because today in medicine, a normal individual who is generally healthy spends maybe ten minutes in front of a physician every year. What that physician can possibly score you on to assess the state of your health is very minimal.
What the wearable-device revolution provides is a way to longitudinally monitor your state—with respect to many different dimensions of your health—to provide a much better, much more accurate profile of who you are, what your baseline is, and how deviations from that baseline may predict a disease state or sliding into a disease state. That means we’ll be able to intervene sooner to prevent you from that kind of slide.
What big data means for patients
What I see for the future for patients is engaging them as a partner in this new mode of understanding their health and wellness better and understanding how to make better decisions around those elements.
Most of their data collection will be passive, so individuals won’t have to be active every day—logging things, for example—but they’ll stay engaged because they’ll get a benefit from it. They’ll agree to have their data used in this way because they get some perceived benefit.
A better understanding of Alzheimer’s disease
For a long time, the plaque and tangles were the driving force for how people were seeking to understand Alzheimer’s and to come up with preventative or more effective treatments. What we were able to do was engage modern technology—the genomics technologies—and go to some of the established brain banks and carry out a much deeper profiling in a completely data-driven way.
We didn’t have to constrain ourselves by the plaques-and-tangles hypothesis. We could say, “We’re going to sequence all the DNA in different brain regions. We’re going to sequence the RNA,” which is a more active sort of sensor of what’s going on at the deep molecular level in different parts of the brain. And then, “We’re going to try to reconstruct predictive or network models to understand how the millions of variables we’re measuring are connected to one another in a cause–effect sort of way,” and, “We’re going to see how those models change between the disease state and the normal, nondemented state.”
Think of these networks as a graphical model where the nodes in the network are different genes and clinical features and DNA variance, and the edges indicate relationships between those variables that we observe over the population of brains we profiled. What we were very surprised to find is that the most important network for Alzheimer’s had nothing directly to do with tangles or plaques, but the immune system. We directly implicated microglial cells—which are sort of the macrophage-type cells of the brain that keep the brain healthy—as a key driver of Alzheimer’s disease.
The Future
One of the biggest problems around big data, and the predictive models that could build on that data, really centers on how you engage others to benefit from that information. Beyond the tools that we need to engage noncomputational individuals in this type of information and decision making, training is another element. They’ve grown up in a system that is very counter to this information revolution. So we’ve started placing much more emphasis on the generation of coming physicians and on how we can transform the curriculum of the medical schools.
Follow us @IoTCtrl | Join our Community
Guest blog post by Ram Sangireddy
As a product manager in the domain of predictive analytics, I own the responsibility to build predictive analytics capabilities for consumer facing and/or enterprise platforms; the business applications vary among item recommendations for consumers, prediction of event outcomes based on classification models, demand forecasting for supply optimization, and so on. We usually see the applications where the predictive model built using machine learning technique(s) is leveraged to score the new set of data, and that new set of data is most often fed to the model on-demand as a batch.
However, the more exciting aspect of my recent work has been in the realm of real-time predictive analytics, where each single observation (raw data point) has to be used to compute the predicted outcome; note that this is a continuous process as the stream of new observations continuously arrive and the business decisions based on the predicted outcomes have to be made in real-time. A classic use case for such a scenario is the credit card fraud detection: when a credit card swipe occurs, all the data relevant to the nature of the transaction is fed to a pre-built predictive model in order to classify if the transaction is fraudulent, and if so deny it; all this has to happen in a split second at scale (millions of transactions each second) in real-time. Another exciting use case is the preventive maintenance in Internet of Things (IoT), where continuous streaming data from thousands/millions of smart devices have to be leveraged to predict any possible failure in advance to prevent/reduce downtime.
Let me address some of the common questions that I often receive in the context of real-time predictive analytics.
What exactly is real-time predictive analytics – does that mean we can build the predictive model in real-time? A data scientist requires an aggregated mass of data which forms the historical basis over which the predictive model can be built. The model building exercise is a deep subject by itself and we can have a separate discussion about that; however, the main point to note is that model building for better predictive performance involves rigorous experimentation, requires sufficient historical data, and is a time consuming process. So, a predictive model cannot be built in “real-time” in its true sense.
Can the predictive model be updated in real-time? Again, model building is an iterative process with rigorous experimentation. So, if the premise is to update the model on each new observation arriving in real-time, it is not practical to do so from multiple perspectives. One, the retraining of the model involves feeding the base data set including the new observation data point (choosing either to drop older data points in order to keep the data set size the same or not drop and keep growing the data set size) and so requires rebuilding of the model. There is no practical way of “incrementally updating the model” with each new observation; unless, the model is a simple rule based; for example: predict as “fail” if the observation falls outside the two standard deviations from the sample mean; in such a simple model, it is possible to recompute and update the mean and standard deviation values of the sample data by including the new observation even while the outcome for the current observation is being predicted. But for our discussion on predictive analytics here, we are considering more complex machine learning or statistical techniques.
Second, even if technologies make it possible to feed large volume of data including the new observation each time to rebuild the model in a split second, there is no tangible benefit in doing so. The model does not much with just one more data point. Drawing an analogy, if one wants to measure by how much the weight has reduced from an intensive running program, it is common sense that the needle does not move much if measured after every mile run. One has to accumulate a considerable number of miles before experiencing any tangible change in the weight! Same is true in Data Science. Rebuild the model only after aggregating a considerable volume of data to experience a tangible difference in the model.
(Even the recent developments, such as Cloudera Oryx, that are making efforts to move forward from Apache Mahout and similar tools (limited to only batch processing for both model building and prediction) are focused on real-time prediction and yet rightly so on batch-based model building. For example, Oryx has a computational layer and a serving layer, where the former performs a model building/update periodically on an aggregated data at a batch level in the back-end, and the latter serves queries to the model in real-time via an HTTP REST API)
Then, what is real-time predictive analytics? It is when a predictive model (built/fitted on a set of aggregated data) is deployed to perform run-time prediction on a continuous stream of event data to enable decision making in real-time. In order to achieve this, there are two aspects involved. One, the predictive model built by a Data Scientist via a stand-alone tool (R, SAS, SPSS, etc.) has to be exported in a consumable format (PMML is a preferred method across machine learning environments these days; we have done this and also via other formats). Second, a streaming operational analytics platform has to consume the model (PMML or other format) and translate it into the necessary predictive function (via open-source jPMML or Cascading Pattern or Zementis’ commercial licensed UPPI or other interfaces), and also feed the processed streaming event data (via a stream processing component in CEP or similar) to compute the predicted outcome.
This deployment of a complex predictive model, from its parent machine learning environment to an operational analytics environment, is one possible route in order to successfully achieve a continuous run-time prediction on streaming event data in real-time.
Follow us @IoTCtrl | Join our Community
This is a guest post from Dana Blouin who writes about IoT at www.danablouin.com. You can follow him on Twitter @DanaBlouin
I recently took a trip to Northern Thailand to support a volunteer effort at a school that serves a rural hill tribe. The project was backed by three Thai startups Knit by Jib, Drvr andBangkok Bike Finder. All outstanding startups that value the idea of doing social good and believe that education is a fundamental necessity.

This school itself isn’t to easy to get to. After taking an overnight train from Bangkok to Chaingmai we still had two days of travel ahead, including the last leg which was a three hour drive in a 4×4 truck through mountain roads and paths.
While I was visiting this village I was wondering how could I help this school through my specific set of knowledge and capabilities with the Internet of Things, there was just one issue. The village the school serves is completely off the grid, no power, no Internet and just to get a mobile signal you have to travel about 15km. How do you get the benefit of the IoT without actually having Internet, or power for that matter?

Well the power issues is fairly easy to address, this is Thailand after all and sun is one thing we have in abundance. There are a number of low power devices that can run via solar power and can be contained in a weatherproof case of some kind.
Of course there are solution in place for such lacks of connectivity, a device can cache data and then send it back up to the cloud later for analysis. Or a mobile device can be used to query sensors once they are in range to get real time data.
So, the tech solutions are there, now just finding out how IoT can help this school was the key. I spent a lot of time exploring the area around the school and talking with the teacher to assess what the school needs to help provide a better learning environment for the community they serve.
Water is really the primary concern for the school at this point. They can only get fresh water about five months out of the year. Water, being sort of essential for life and all, clearly moves to the top of the list. Knit by Jib is working on a project now that will help extend how high up on the stream the schools water is sourced from; which should allow them to get clean, fresh water year round.
Just because the IoT can’t physically bring the water to the school doesn’t mean it won’t have a role to play. I can envision sensors used for the water tanks at the school to measure level, letting the teacher know when they need to turn the valves on to fill the tanks, or even possibly some sensors to check water quality, I still have some more research to do on this front.
Another issues that the teachers face is nutrition, as the diet of the locals is very limited. It is often the case that the only balanced meal the students get each day is prepared by the teachers at school. To this end the teachers are currently running a school garden where they grow the food that is used in some of the students meals. An automated watering system linked to a soil moisture sensor seems to be a simple project that can be put together to help out in this regard. Of course because there is no electricity in this village the system would have to be solar powered so it could operate consistently, and then that whole system would need to be maintained. All are interesting challenges.
Ultimately it comes down to how much benefit can this school get from technology projects like this. Just installing them could help a little bit, but I am unsure how much benefit it would really be. I have been thinking that the biggest help these projects could accomplish would be as a learning experience for the children and maybe provide some inspiration along the way. The point of these projects and outreach is to benefits the school in its mission to provide quality education to this remote, rural area. I have a lot more thought to put into this before I can decide what, if any benefit can be offered through technology. I will be sure to post more here as I work through ideas.

Predictions are in our DNA. Millions of us live with them daily, from checking the weather to reading daily horoscopes. When it comes to Big Data, the industry has shown no shortage of predictions for 2014. In fact, you might have read about insights on women in data science, ambitions for Machine Learning or a vision for the consumerization of Advanced Analytics.
It is quite difficult to accurately assess when these predictions will materialize. Some of them will see the light of the day in 2014 but many might take until 2020 to fully mature.
Wearable Devices and Big Data
Take the case of wearable devices. There is no question that mobile phones, tablets and smart watches will become pervasive over the next 5 years. According to Business Insider, the market for wearables could reach $12B in 2018 and theses devices have a strong potential for changing our habits all together.
The only issue is how quickly we will adopt them and in turn get clear value from them. Pioneers like Robert Scoble have made a great case for the opportunity but also have provided a down to earth perspective for the rest of us (his recent article on “Why Google Glass is doomed ” is a gem).
So, I predict that, while the tipping point for such technologies might be 2014, but the true disruption might not happen before 2020. Why? Definitions and Center of Design.
For starters, the definition of a “wearable device” is still very loose. I’m a big fan of devices like the Jawbone UP, the Fitbit and the Basis watch. In fact, I’ve built an analytical system that allows me to visualize my goals, measure and predict my progress already. My “smart devices” collect information I couldn’t easily understand before and offer the opportunity to know more about myself. Big Data growth will primarily come from these types of smart devices.
The wearables that are still confusing are the so-called “smart-watches”. Theses watches, in my opinion, suffer from a “Center of Design” Dilemna.
Let me explain: the technology industry is famous for wanting new technologies to sunset old ones. When Marc Benioff introduced Chatter, he said it would obliterate email. When PC shipments went down, the industry rushed to talk about the “Post-PC” era. Have any of these two trends fully materialized yet?!
The answer is unfortunately not simple. Smart watches, phones, tablets and PC all have a distinct use cases, just like email and social apps. Expecting that one technology would completely overlap the other one would be disregarding what I call a product’s “center of design”. The expression refers to the idea that a particular technology can be stretched for many uses but that it is particularly relevant for a set of defined use cases. Let’s take the example of the phone, tablet and PC:
- A phone is best used for quickly checking texts, browsing emails, calendar invites…and of course making phone calls (duh!)
- A tablet is best used for reading and browsing websites, documents, books and emails. Typing for 12 hours and creating content is possible but it’s not a tablet’s center of design…
- A PC or a Macbook are best for creating content for many hours. They might be best for typing, correcting and working on projects that require lots of editing.
When I see an ad like this on the freeway, I really question the value of an additional device. What can a watch in this case add, if the wrist that wears it, is also connected to a hand that holds a much more appropriate device?
Big Data from Wearables is a Predictive Insight for 2020 in my opinion, because I think that, by then, the broad public will have embraced them into use cases that truly add value to their lives.
--
Bruno Aziza is a Big Data entrepreneur and author. He’s lead Marketing at multiple start-ups and has worked at Microsoft, Apple and BusinessObjects/SAP. One of his startups sold to Symantec in 2008 and two of them have raised tens of millions and experienced triple digit growth. Bruno is currently Chief Marketing Officer at Alpine Data Labs, loves soccer and has lived in France, Germany and the U.K.
Originally posted on Data Science Central
Follow us @IoTCtrl | Join our Community
The Internet of Things refers to the network of physical objects which are embedded with software, electronics, network connectivity and sensors which enable the objects to exchange and collect data. Internet of Things is defined as an invisible and intelligent network of things that communicate indirectly or directly with each other. The internet is used to facilitate experience and efficiency. Internet of Things enable the communication between the physical objects and other Internet-enabled systems and devices. In addition, technological advancement in the field of healthcare, government initiatives for the expansion of Internet of Things and need to increase efficiency and cost reduction are the major factors that are driving the Internet of Things market globally. However, security risk and over-reliance on technology are posing challenges to the growth of the Internet of Things market.
The global Internet of Things market is segmented on the basis of technology into: ZigBee, Bluetooth low energy (BLE), near field communication (NFC), Wi-Fi and radio frequency identification (RFID). Wi-Fi technology led the global Internet of Things market in 2014. Key growth factors driving the Wi-Fi technology market owing to its wide usage across several industries such as campuses, schools, office buildings, lodging and residential homes among others. Wi-Fi can provide secure connection with software-defined networking by scanning and securing the devices at network entry point.
By application, global Internet of Things market is divided into: industrial, automotive, consumer electronics, retail, healthcare and others (including energy and utilities, and entertainment). As of 2014, industrial sector was the largest contributor in the global Internet of Things market. The potential for cyber physical systems to improve productivity in the supply chain and production process are increasing the demand for Internet of Things. Healthcare and consumer electronics sectors are expected to be the fastest growing applications in the Internet of Things market globally.
By geography, as of 2014, North America led the global Internet of Things market, accounting for 38.6% of the overall market. The rapid growth of industrial, automotive and healthcare industries is the major factor driving the growth of Internet of Things in North America. Europe held the second largest market share and the demand for Internet of Things market is expected to increase during the forecast period in the region. The market in Europe is primarily driven by government regulation supporting the growth of Internet of Things. The strong regulations in place will ensure the effective operability of the Internet of Things concept in various application areas. The automotive industry is expected to contribute a large share in Europe. Asia Pacific is expected to be the fastest growing region throughout the forecast period.
Originally posted on Data Science Central
Follow us @IoTCtrl | Join our Community
What’s exciting about any new tech trend is that there is often a groundswell of start-ups out to create new products and services. Combine that with established companies also making investments and you have a dynamic new industry that is full of booms, busts and opportunity.
To help sort this out, we’re starting something new at IoT Central - the company spotlight. Up first is ThingWorx, a company that I keep coming across. The owners of ThingWorx is a PTC, a publicly listed company that employs nearly 6,000 people worldwide, serving more than 28,000 businesses and has approximately $1.3 billion in annual revenue. PTC has its roots in product lifecycle management and has recently taken on the IoT mantra.
Jim Heppelmann, CEO of PTC, said recently, "IoT gives us connectivity during the product's longest life cycle. First, things are products, which we could call the Internet of Products (IoP). Secondly, we want to serve these products better, and we can only do that by knowing what is going on. Lastly, we want to engineer products better. IoT really is PLM, putting the product at the centre of PLM. We are reinventing PLM."
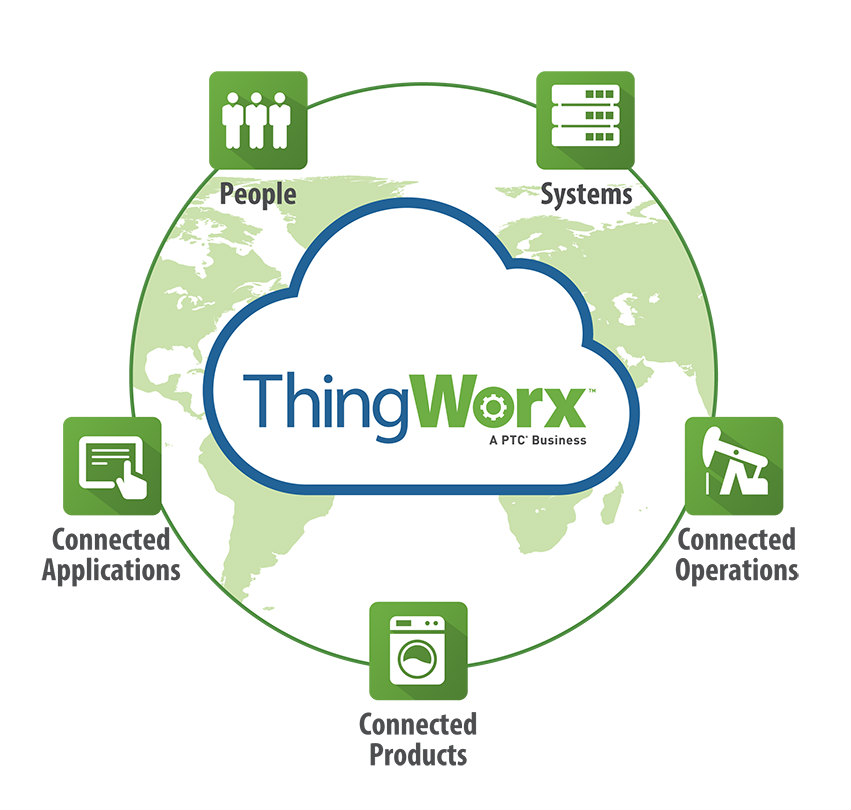
Enter ThingWorx, which PTC acquired in December 2013. According to the company, ThingWorx is an IoT platform designed to build and run IoT applications, and enable customers to transform their products and services, innovate and unlock new business models. The idea behind the platform is to reduce the time, cost, and risk required to connect, manage, and develop applications for smart, connected products such as predictive maintenance, system monitoring, and usage-based product design requirements.
ThingWorx solutions include tools from Axeda, another PTC acquisition that allows developers to securely connect machines and sensors to the cloud.
So What Thing Works?
ThingWorx offers three products:
-
ThingWorx IoT Platform - provides a complete application design, runtime, and intelligence environment.
-
ThingWorx Machine Learning - brings advanced and predictive analytics capabilities for ThingWorx developers.
-
ThingWorx Marketplace - brings together hardware and software vendors with IoT app developers and solution providers within an online exchange.
ThingWorx IoT Platform is the flagship product and is composed of:
- ThingWorx Composer: An end-to-end application modeling environment for building applications. Allows you to model the things, business logic, visualization, data storage, collaboration, and security required for an IoT application.
- Codeless Mashup Builder: A “drag and drop” solution to rapidly create rich, interactive IoT applications, real-time dashboards, collaborative workspaces and mobile interfaces without the need for coding.
- Event-Driven Execution and 3D Storage Engine: To make business sense of the massive amounts of data from people, systems and connected “things.”
- Search-Based Intelligence: This so-called SQUEAL (Search, Query, and Analysis) brings search to the world of connected devices and distributed data.
- Dynamic Collaboration: This sounds like Slack for PLM and IoT. It’s a module that virtually brings together people, systems, and connected equipment and utilizes live collaboration sessions.
- Business Process Management: Enables automation and orchestration of events, processes and communication across physical things, business systems and people.
- Thing Management: A portfolio of standard and advanced capabilities to monitor, interact with and update connected things.
- Digital-Physical Integration Hub: Provides an integration framework for both physical and digital information.
- Administration: A console for role based access for business and system administrators and developers.
If you have any experience with ThingWorx, feel free to leave a comment. Also, if you have any suggestions for future spotlights, please comment and I’ll add it to my queue. We’d love to hear from you.
Guest blog post by Martin Doyle

The company that made your smartphone is no longer a hardware manufacturer. It has become adept atharvesting and managing data from it users, too. Every device has a series of sensors, as well as a user login and an account where data is stored.
For manufacturers of wearable technology, there’s value in knowing how we spend our time: where we go, what we do, and how we like to exercise. Companies like Nike prove how this works.
The First Nike Device
Nike first attempted to harvest data from its customers in the late 1980s. It launched the Nike Monitor, a wearable device that cost $225 and used “ultrasound burglar alarm technology” to record data on the runner’s pace and distance. The sonar pedometer was a flop, but it paved the way for Nike+, a service that would follow 20 years later.
Today, Nike+ collects data from a range of devices, and has more than 28 million users worldwide. It is a software platform, accessed via a series of apps. Users voluntarily connect and upload their statistics to the cloud.
Now, consider the fact that the Nike FuelBand, a wearable tracker, is widely considered to be a flop. In fact, Nike has shelved its hardware to focus on data. To understand why Nike is more interested in Nike+ than the FuelBand (or the Monitor), we need to look closely at the relationship between data and consumer behaviour.
Integrating Data
In the mid-2000s, Apple was selling a sport kit to integrate Nike+ into its iPods, and launched a branded version of the iPod in 2006. Thanks to the integration of music data and pedometer readings, Nike was able to determine users’ favourite running songs from its app.
Six years ago, Nike had data on running trends across entire continents, and it understood the way seasonal weather affects users’ habits. Fitbit, Jawbone and other companies would later develop their own version of the fitness tracker, a market which is growing in value every month.
Fitness data is a goldmine for all kinds of industries, from diabetes research to health insurance and the provision of essential services. For companies like Nike, data from a fitness device helps them to develop new shoes for particular activities, market those shoes in the right continents, and focus marketing efforts in the right places at the right time. Apple wants to know which songs runners like to listen to, as they have an interest in selling mp3s. Let’s not forget that Tim Cook, the CEO of Apple, is a Nike board member, and has been for almost a decade.
As you upload your latest run data to Nike+, you upload all kinds of metadata about your location and habits that will shape the products and services of tomorrow. How many companies have access to that data, and can you be sure that it’s accurate?
Trust and Data
While all of the data generated by wearables can drive positive innovation, the recent TalkTalk hack is a timely reminder of how easily things can go awry. TalkTalk’s customer database was hacked by a teenager; the data was allegedly incomplete, but unencrypted.
By wearing a fitness tracker, or a smartwatch, we are contributing to a huge data silo in the cloud, and that silo could be shared between different companies with our consent. Companies like Nike are starting to step back from hardware development and focus on harvesting and organising data, using services like Nike+ as a platform that other providers can tap into. When you buy a scale from Fitbit, or a smartwatch from LG, your statistics and usage patterns are shared with third parties that integrate with the service.
If we are to continue offering up our data using wearables and cloud technology, we need to trust the gatekeepers that access it, and there needs to be standards in place to remove risk to businesses and consumers. In TalkTalk’s case, stolen addresses and phone numbers have lead to identity theft and a public enquiry. Even if there is no hack, inaccurate data and duplicated accounts can cause poor reporting, and if the data was ever used for a life or death assessment of health, we need to know that it is accurate and up to date.
Your Responsibility For Data
The smartwatch has taken the baton from fitness wearables, from the Pebble in 2002 through to the Apple Watch in 2015, as well as devices made by Samsung, Motorola, Sony and others. According to KPMG, 74 per cent of us are happy to wear these devices. They can exchange data with sensors around us using Bluetooth and WiFi, and offer a convenient way to interact with our environment through Internet of Things (IoT) devices.
Already, health insurers are offering discounts to wearers of smartwatches, in return for access to their activity statistics. In the US, 68 per cent of consumers say they’d exchange their data for lower health insurance premiums. In Canada, the data from a woman’s Fitbit wearable tracker was used in court in place of a doctor’s examination.
But 41 per cent say they would be uneasy about sharing health data with their boss.
Our data is already being collected through our use of the web and our smartphones. It’s not a question of whether our personal data will be used, but when, and whether the companies involved are taking the right steps to ensure data quality and effective management. As data quality experts, it’s our responsibility to ensure that data is cleansed, deduplicated and held according to the law. Personal data is no longer anonymous, and the Internet of Things will only muddy the waters as our data silos get bigger and bigger.
We all have a responsibility to take data seriously now, and put measures in place to ensure that data is used ethically. Companies like Nike have proven the value of data, and the need for trust from the users who opt in to its collection.
Follow us @IoTCtrl | Join our Community
Vitria’s IoT analytics platform enables you to transform your business operations and boost revenue growth through Faster Analytics, Smarter Actions, and Better Outcomes Faster.
Faster and unified analytics via Temporal Analytics Engine over all data types and cycles. Smarter Actions enable better outcomes by combining prescriptive analytics with intelligent actions. Self-service and automation capabilities empower teams to accelerate time-to-value. and create analytics solutions in minutes vs. months.
Tellient's IoT Analytics gives you the whole story with beautiful graphs for humans, organized data for machines, designed for the Internet of Things. As the only analytics platform built specifically for the Internet of Things, Tellient's IoT Analytics helps manufacturers of smart connected devices know what those devices are doing so they can make them better.
ParStream’s Analytics Platform was purpose-built for scale to handle the massive volumes and high velocity of IoT data. The Platform helps companies generate timely, actionable insights from IoT data by providing more innovative and efficient ways to analyze that data – faster, with greater flexibility and closer to the source. The Platform uniquely queries at the source of data for real-time analysis as data is being loaded. It also provides unified analytics of real-time data in every query and generates more accurate insights for decision-makers with the continuous import of new data.
IBM Internet of Things Foundation provides simple, but powerful application access to IoT devices and data to help you rapidly compose analytics applications, visualization dashboards and mobile IoT apps.
Dell has empowered its users with a powerful business data analytics tool named ‘Dell Statistica’, which is capable of delivering wide range of solutions to various sectors say process optimization in manufacturing sector to fraud detection in banking industry and it even allows analytics on the gateway providing faster local insights.
It offers a platform for operational intelligence that assists you to search, monitor, analyze and visualize machine generated big data from various websites, networks and other IoT devices. In recent announcement, Splunk is to deliver Real time Analytics and Visualization for AWS IoT Service.
Intel® IoT Analytics Platform
This beta cloud-based analytics system for IoT includes resources for the collection and analysis of sensor data. Using this service, you can jump-start data acquisition and analysis without having to invest in large-scale storage and processing capacity.
Sensor, machine-to-machine, and network data are expected to play a larger role in analytics as the Internet of Things becomes a reality. However, these data types present significant challenges related to data volume and variety, as well as predictive modeling. Pentaho provides the ability to blend operational data with data from your IT systems of record and deliver intelligent analytics to those stakeholders who need them most.
Originally posted on Data Science Central
Follow us @IoTCtrl | Join our Community
Guest blog post by sagar Gavhane
The Internet of Things (IoT) is the third wave in the development of the Internet, following the development of Internet connectivity for desktops and then mobile devices. IoT is making everyday objects smarter and more connected. Although the adoption of this networking technology has been slow, companies that have incorporated IoT technologies have experienced soaring profits and enhanced efficiency. Due to the ability of the Internet of Things to collect and report real-time data in a healthcare, business, and industrial environment, it is projected to revolutionize the way we perceive things. This utility of IoT is now increasingly being realized in the insurance industry.
In the present-case scenario, companies in the insurance industry collect premiums from policy holders, channel this money into investments, and then reimburse the money in case of an accident, death, or maturation of policy. The majority of the existing policies in the insurance sector are created using historical data. However, with the adoption of the Internet of Things in the global insurance industry, this will undergo a dynamic shift.
How Real-time Data Analysis via IoT Tech will Transform Global Insurance Industry
The Internet of things will help insurers price their products based on historical data and real-time data. This will allow insurers to provide customized and fair policies. The IoT will also help insurers reduce risk and mitigate costs in many ways. A few healthcare insurers are offering consumers lower premiums, free fitness trackers, and other benefits to help consumers meet their daily exercise goals.
Property insurance firms are using drones to analyze damages after an accident. Drones are projected to improve the workflow efficiency of insurance adjusters by more than 40%. Pay-as-you-drive car insurance, for instance, allows insurers to charge consumers according to their driving behavior.
Indian Government Taking Efforts to Drive Economic Growth Using IoT
Similar to global companies, many Indian companies in the manufacturing sector and insurance industry are expected to deploy IoT technology to fuel their efficiencies. In 2014, the Government of India declared that it was planning to create a US$15.0-bn IoT market in the nation in the coming five years. Commercialization of the Internet of Things in India is expected to offer high prospects for the global market.
Role of IoT in Indian Insurance Sector
IBM states that the IoT can prove to be a boon for the insurance segment in India. Consumers in India can avail healthcare services in a much more precise and customized manner through IoT technology. For example, wearable fitness bands will allow elderly consumers to monitor their health data frequently. This real-time data will allow doctors to prioritize treatment for patients who need immediate medical care. Similarly, data from interconnected smart devices in a home environment will allow insurance companies to keep an eye on the home when nobody is at home. This will decrease incidents such as thefts and allow insurers to protect assets in a home. The IoT offers a plethora of opportunities in the Indian insurance industry not only to established players, but also to new entrants. Firms such as Cisco, Intel, and IBM are using their venture funds to invest in insurance companies.
Compromised Privacy: Major Hurdle in Adoption of IoT in Indian Insurance Industry
The adoption rate of the Internet of Things in India’s healthcare, manufacturing, and insurance sectors is low due to unwillingness of companies to adopt IoT technology, lack of awareness, high cost associated with IoT devices, and infrastructure issues. Apart from these issues, the lack of privacy is another major concern the IoT insurance market needs to address. Smart connected technologies are making things transparent; however, due to their very nature they carry the risk of compromising private data. The way the insurance sector deals with this concern will, in a large way, determine the course the adoption of IoT will take in the next few years.
The Research Report can be seen here.
Follow us @IoTCtrl | Join our Community
Guest blog post by Vinay Mehendiratta, PhD
Time Series Forecasting and Internet of Things (IoT) in Grain Storage
Authors: Vinay Mehendiratta, PhD, Director of Research and Analytics, Eka Software
Sishir Kumar Pagada, Senior Software Engineer, Eka Software
Created as part of the Data Science for IoT practitioners course – starting Nov 10 2015
The pdf version of this paper may be downloaded HERE
Abstract
Grain storage operators are always trying to minimize the cost of their supply chain. Understanding relationship between receival, outturn, within storage site and between storage site movements can provide us insights that can be useful in planning for the next harvest reason, estimating the throughput capacity of the system, relationship between throughout and inventory. This article explores the potential of scanner data in advance analytics. Combination of these two fields has the potential to be useful for grain storage business. The study describes Grain storage scenarios in the Australian context.
----------------------------------------------------------------------------------------------------------------------------------------
Introduction
There is sufficient grain storage capacity across most of Australia to cater for a range of seasonal outcomes. There is about 55 Million Metric Ton (MMT) of bulk handling storage capacity at 623 sites across Australia. Combined with an estimated 15 MMT of on-farm storage capacity, Australia has the capacity to store the equivalent of two years’ average grain production. As a result, grain storage fees are kept relatively low and are falling in real terms [1].
As grain facilities and port terminals investigate methods to increase throughput and grow revenues, it is becoming important to maximize resource utilization and understand throughput. A typical busy site could receive as high as 400 trucks a day during harvest season.
Data collected at individual storage facilities provides visibility of stock across all storage sites. An RFID Scanner at the storage site entrance registers information on truck arrival time and is mapped to tonnage, grower, grade, commodity type, and quality. This activity is known as ‘receival’ in grain storage operations. RFID Scanner at the storage site exit registers information on truck departure time and is mapped to tonnage, grower, grade, commodity type, and quality. This activity is known as ‘outturn’ in grain storage operations. Storage facilities also have access to grain movement information from one site to another site (‘between-site-movements’) and within a site (‘within-site-movements’).
The question we address is: Could ‘Internet of Things’ and ‘Predictive Analytics’ help understand receival and outturn behavior at grain storage sites? Could we make better usage of this data?
Predictive Analytics Platform
The High level flow of data at a grain storage site is described below.
Figure 1: Internet of Things specific Architecture
We consolidated receivals, outturns information received by sensors at month level for the last 5 years. Understanding of those patterns can be used in planning for the site operations at harvest season and other seasons. The rest of the document is arranged as shown in Figure 2.
Figure 2: Document and Methodology Flow
Input Processing: Receival and outturn is a frequent activity at some sites but not all. Unavailability of data at regular interval at those sites made it impossible to analyse daily operations and at site level. We aggregate data across sites, commodities, and grades at month level to overcome this issue of missing values. We determine inventory snapshot using receival and outturn data.
Inventory at the end of month = Initial Inventory at the beginning of month + Receival Quantity during this month – Outturn Quantity during this month.
Time Series Modeling – Identify patterns in historical data
Time series is sequence of observations (generally quantitative observations) taken at equally spaced time intervals. An inherent feature of time series is that adjacent observations are dependent/related. Time series analysis is mainly concerned with analysis of the dependence among adjacent observations. Sensor data captured at various discrete time periods is a time series and suitable for time series modeling. There are various packages available in R to decompose a time series. A tutorial on time series in R can be found at [8]. Time series decomposition (using software R) breaks observations into three components. Decompose method of R was used to determine the trend, seasonality, and random pattern in this study. We provide the code snippet below:
tsObject<-ts(QuantitySeries,start=c(fromYear,fromMonth),frequency=frequencyInt)
decomposedTs <- decompose (tsObject, type="additive", filter=NULL)
fromMonth and fromYear is the earliest observation of receival and outturn data. frequencyInt is the number of observations in a year in this dataset. More information on configuring these parameters is available at [7]. QuantitySeries is the name of the dataset brought into R by reading a csv file.
Plot function is used to generate all the graphs used in this report.
plot.ts(tsObject)
Trend: This component looks for the trend in observed data whether observations have increasing or decreasing or constant trend over time. The function determines the trend component using a moving average.
trendComp <- decomposedTs$trend
- Seasonality: This component looks for the cyclic pattern in observed data over time. It is computed by averaging, for each time unit, over all periods.
seasonalComp <- decomposedTs$seasonal
- Random: This component looks for observations that are not explained by trend and seasonality. It is achieved by removing trend and seasonal figure (recycled as needed) from the original time series.
randomComp <- decomposedTs$random
Receival Volumes at sites: Historical receival data is plotted in Figure 3. We used this data and fed to decompose [2] package of software R to understand the patterns. One can easily interpret from Figure 4 that receivals do increase dramatically during harvest season every year as shown in seasonality graph of Figure 4. Receivals are increasing every year until 2013. Moving average (plotted in trends section) in receivals have come down during 2013-2014 as shown in Figure 4.
Figure 3 : Receival Time Series Figure 4: Patterns for Receival Time Series
Outturn Volumes at sites: Historical outturn data is plotted in Figure 5. We used this data and fed to the decompose package of software R to understand the patterns. One can easily interpret from trend section of Figure 6 that outturns do increase steadily every year until 2013. Outturns also do show a very strong ‘seasonal’ behaviour as shown in ‘seasonal’ section of Figure 6.
Inventory Volumes at sites: Historical inventory data is plotted in Figure 7. We used this data and fed to the decompose package of software R to understand the patterns. One can easily interpret from Figure 6 that inventory volume increases during harvest time every year. Inventory build was higher when harvest season had more receival tonnage. Inventory is the result of receivals and outturns. It does show seasonality behaviour similar to receival and outturn activity pattern as shown in ‘seasonality’ section of Figure 8.
Time Series Forecasting
To make forecast for future periods, time series extrapolates the observed dependence relationships among available observations to future periods. Time series forecasts for future periods are based on analysis of dependence relationships, such as trend and seasonality, among available observations. We divided the data into two parts – training data and test data. Training data (from Jan, 2010 to Dec, 2013) was used to allow our models learn from history. Test data (From Jan, 2014 to Oct, 2014) was used to test the accuracy of model generated using training data. The objective was to identify any pattern in receivals (client, grower), outturns, and resultant inventory that can be used to understand grower’s operations, market behavior, and bottlenecks in warehouse efficiency.
There are many packages available within R that can be used to forecast receival, outturn with varying degree of accuracy. One has to test and check results to find the package that gives better results. We did use two such algorithms: ARIMA and Holt-Winters.
Arima: We use auto.arima () function available in forecast package of R [9]. This function automatically finds best fitting Arima [3] model to the data. Residuals are the actual values minus the fitted values.
tsObject <- ts(QuantitySeries, start=c(fromYear,fromMonth), frequency=frequencyInt)
arimaFit <- auto.arima(tsObject)
arimaResiduals <- residuals(arimaFit)
Holt-Winters: We use Holt Winters Exponential Smoothening model [4] with trend and seasonality.
trend <- isTrend
seasonality <- isSeasonality
hwFit <- HoltWinters(tsObject, beta=TRUE, gamma=TRUE)
beta = TRUE setting would include the trend component. gamma is the parameter used for the seasonal component. If set to TRUE, a -seasonal model is fitted. We calculate the sum of squared errors (SSE) for the in-sample forecast errors, that is, the forecast errors for the time period covered by our original time series.
arimaErros <- sum(arimaResiduals^2)
hwErrors <- hwFit$SSE
We compare the model accuracy of Arima and Holt-Winters for given data. The model that provides the forecast with the minimum value of SSE is chosen to make forecast for the future periods. Code is provided below:
if (arimaErros <= hwErrors){
print ("Using Arima")forecastedValues <- forecast(arimaFit, h=10)
}
else if (arimaErros > hwErrors){
Print ("Using Holt-Winters")
forecastedValues <- forecast.HoltWinters(hwFit, h=10)
}
forecastedValue <- as.data.frame(forecastedValues)
Figure 11: Receival, Outturn, and Inventory Forecast
Results of time series forecasting are shown in Figure 11. It is important to consider point forecast as well as forecast with confidence intervals. People responsible for site operations have consider next harvest season related news, weather, and crop yield information to decide the confidence interval that should be used for various purposes. Forecast with confidence intervals can be used to devise strategies for various scenarios and assess future uncertainty.
Relation between scanner data and internal movement data
We also considered movements within-the storage-site from one bin to another. We found that volume of movements within-the storage-site was increasing from year 2012 to 2014 (Figure 12, 13). We are aware that outturns increased while receivals and inventory decreased from year 2012 to 2014. Inventory volume had touched the peak during 2012.
We also observed that as inventory volume went down, movement volume within-the storage-site increased while volume moved between-storage-sites decreased. That bodes well for bulk storage handlers trying to reduce the cost of supply chain.
Figure 12: Movements within-the-site time series Figure 13: Patterns for movement within-the-site series
Figure 12a: Movements among sites Figure 13a: Patterns for movement among sites
Figure 14: Client Receivals Figure 15: Patterns for Client Receivals
Grower Receivals – Figure 15, 16 show us that peak volume reached during harvest receivals from growers is decreasing. Receival volume from clients is also decreasing steadily. Impact of this cause is clearly visible in declining volume of inventory at sites from year 2012 to year 2013 and further. Is on-farm storage and high cost of storage one of the reason for reduced receivals?
Figure 16: Grower Receivals Timeseries Figure 17: Patterns – Grower Receivals
Conclusion
Analysis of receival and outturn data Storage data might be beneficial for an organization to gain insights into the behavior of storage sites. One could determine the relationship between throughput and inventory, throughput and internal movements to measure the efficiency of operations. This analysis can be useful to plan for next harvest season. It might be worthwhile performing the time series modeling at daily level during harvest season for major/busy sites. Our objective in this article has been to promote the use of Advance analytics and scanner data (IOT) has the potential to be useful for grain storage business.
Created as part of the Data Science for IoT practitioners course – starting Nov 10 2015
The pdf version of this paper may be downloaded HERE
References
- The cost of Australia’s bulk grain export supply chains, http://www.aegic.org.au/media/22950/140130%20Final%20AEGIC%20Supply%20Chains%20Report.pdf, Australian Export Grains Innovation Center
- https://cran.r-project.org/
- https://en.wikipedia.org/wiki/MongoDB
- https://stat.ethz.ch/R-manual/R-devel/library/stats/html/decompose.html
- https://en.wikipedia.org/wiki/Autoregressive_integrated_moving_average
- https://en.wikipedia.org/wiki/Exponential_smoothing
- http://127.0.0.1:20382/library/stats/html/ts.html
- https://a-little-book-of-r-for-time-series.readthedocs.org/en/latest/
- https://cran.r-project.org/web/packages/forecast/index.html
Follow us @IoTCtrl | Join our Community
I recently shared the Top 10 Books to Read Now on IoT. In an attempt to keep everyone smarter and share resources in the most simple way, I created the ever ubiquitous listicle by compiling what I believe are the Top 50 IoT people to follow on Twitter. These are, as far as I can tell, real people and not brands.
How did I compile this list? No hard data science here, just good old grunt work from researching, reading and talking with people over the last few months. If you have any suggestions or if I missed an important person, please leave a comment. Or better yet, tweet to me @DavidOro.
If you make it to the bottom of this list, I provide an easy way for you to follow them all with just one click.
Without further adieu, the Top 50 in no particular order.
-
@gigastacey - Stacey Higginbotham. OK, I put Stacey Higginbotham first on purpose cause I like her and for the fact that she’s been reporting on IoT or years and also hosts the popular podcast iotpodcast.com
-
@Kevin_Ashton Credited with coining the term “Internet of Things”
-
@mjcavaretta Michael Cavaretta, Manager, Connected Vehicle Analytics, Ford Motor Co.
-
@techguyadam Adam IoT, Content Editor for http://www.appcessories.co.uk
-
@chrismatthieu Chris Matthieu, Director IoT Engineering at Citrix
-
@CB_Telzerow Alex Telzerow, Editor-in-Chief COMPUTER BILD
-
@JonBruner Director of hardware and IoT @OreillyMedia
-
@timoelliott Timo Elliott, Innovation Evangelist at SAP
IoT Central members can see the full list here. Become a member today here.
Guest blog post by pansop
For those coming in late, IoT is the network of physical objects or "things" embedded with electronics, software, sensors and connectivity to enable it to achieve greater value and service by exchanging data with the manufacturer, operator and/or other connected devices. Each thing is uniquely identifiable through its embedded computing system but is able to interoperate within the existing Internet infrastructure.
Source for picture: Wikipedia IoT article
The key underlying theme of the IoT sector is the amount of data that will be generated by these inter-connected devices. Given the growth of these connected devices & the IoT sector, we decided to look at career & professional opportunities in this sector.
Here are the top companies hiring for IoT related positions:
| 1 | PTC - The Product Development Company: PTC provides technology solutions that transform how products are created and serviced, helping companies achieve product and service advantage |
| 2 | Amazon: The leader in e-commerce and cloud computing |
| 3 | Continental: Continental is a leading automotive suppliers worldwide |
| 4 | Savi Group: Savi Technology provides sensor-based analytics, software and hardware for managing and securing supply chain assets |
| 5 | Intel: Intel is one of the world's largest and highest valued semiconductor chip makers |
| 6 | Ayla Networks: Ayla Networks enables manufacturers and service providers to bring connected products to market quickly and securely |
| 7 | HP: HP provides hardware, software and services to consumers, small- and medium-sized businesses, large enterprises, governments |
| 8 | LogMeIn, Inc: LogMeIn provides SaaS and cloud-based remote connectivity services for collaboration, IT management and customer engagement |
| 9 | Red Hat, Inc: Red Hat provides open-source software products to the enterprise community |
| 10 | Honeywell: Produces a variety of commercial and consumer products, engineering services, and aerospace systems |
| 11 | IBM: IBM manufactures and markets computer hardware and software, and offers infrastructure, hosting and consulting services in areas ranging from mainframe computers to nanotechnology |
| 12 | Renesas: Renesas is a semiconductor manufacturer |
| 13 | Cisco Systems, Inc : Designs, manufactures, and sells networking equipment |
| 14 | Dell: Develops, sells, repairs and supports computers and related products and services |
| 15 | InterDigital: InterDigital develops wireless technologies for mobile devices, networks, and services |
Apart from these companies other large companies like Booz Allen Hamilton, Informatica, Bosch Software, Verizon Wireless, Accenture are also hiring for various IoT related positions.
Given below is a map & the top locations that companies are hiring for IoT positions

| 1 | Santa Clara, CA |
| 2 | Seattle, WA |
| 3 | Chicago, IL |
| 4 | Boston, MA |
| 5 | Austin, TX |
| 6 | Washington, DC |
| 7 | Alexandria, VA |
| 8 | San Francisco, CA |
| 9 | Sunnyvale, CA |
| 10 | Glendale, CA |
Here is a more comprehensive list of job titles that companies are looking to hire for:
Data related jobs
| Big Data Lead (IoT) |
| Data Scientist - IoT |
| Data Engineer - Sensors and IoT |
| Data Engineer Sensors and IoT Applications |
Director level positions
| Director of Data Engineering Sensors, Sensor Analytics and IOT |
| Director of DevOps - Sensors, Sensor Analytics, and IoT |
| Director of Product Management, Industrial IoT |
| Director of Sales - IoT/RFID/GPS/AutoID/Sensor Technologies |
| Director, Business Development, IoT (The Internet of Things) |
| Internet of Things (IOT) & Connectivity / Mobility Sales & Director |
| Product Marketing Director: IoT Platform Startup |
| Research Director: Information Assurance and IoT Security |
| Sales Director (IoT) |
| Internet of Things (IoT) Worldwide Sales Leader |
Architect level positions
| Azure Cloud Architect (IoT) |
| Digital Operations - IoT Consultant/Architect |
| Internet of Things (IoT) / Cloud Archtect |
| IoT Fog Architect |
| IoT Software Architect "Internet of Things" Cloud |
| IoT Solutions Architect |
| Senior Electrical Architect for IoT |
| System Architect / IoT/Emerging Technologies |
Project and Product manager level positions
| Sr. Project Manager-IoT |
| Healthcare Facilities IOT- Project Manager (C) |
| Senior Product Manager - IoT Operating System |
| IOT Platform Product Manager |
| Software Product Manager/Product Owner Wearables/IoT |
| Product Development Program Manager - Wearables - IoT |
| Product Manager - Internet of Things (IOT) Smart Cities |
| Software Product Manager/Product Owner Wearables/IoT |
Marketing Manager positions
| Product Marketing Manager, IoT Solutions |
| Strategic Marketing Manager, IoT |
| Segment Marketing Manager - IoT Technologies |
| Marketing Manager, Demand Generation (IoT - PaaS) |
| Staff Product Marketing Manager - IoT Content Specialist |
Business Development Manager level positions
| Business Development Manager (IoT) |
| Embedded and IoT Market Development Manager |
| Integrated Operations Team (IOT) Business Manager |
| IoT Strategic Business Development Manager |
| Product Business Manager - Wearables - IoT |
| Strategic Business Development Manager - IoT |
Other manager Level Positions
| Connected Spaces IoT - Manager |
| Manager Emerging Technology (IoT Mobile NLP Big Data) |
| IoT/Cloud Infrastructure Program Manager |
| IOT Manager |
| Technology Manager (Mobile, IoT, NLP) |
| Global Strategic Partnerships Manager - IoT |
| Regional Sales Manager - Regional Sales Manager, IOT |
Consultant Positions
| Connected Spaces IoT Consultant |
| Digital Operations - IoT Consultant/Architect |
Software Engineering Positions
| Software Engineer Mobile Apps - IoT |
| Senior Software Engineer, Cloud Services (IoT PaaS) |
| Staff/Senior Staff Software Engineer, Internet of Things |
| Software Engineer - IoT |
| Associate Software Engineer - IoT |
| Applications Engineer- IoT mbed |
| Software Engineer Sensors and IoT Applications |
| Software Engineer IoT and Sensors |
| C++ Software Developer (Smart Lighting IoT) |
| IoT Developer |
| Senior Development Engineer, Mobile (IoT PaaS) |
Java Developer Positions
| Java Developer for Internet of Things (IoT) |
| Java Developer (IoT & M2M) |
| Java Developer Consultant - IoT |
Mobile Developer Positions
| IoT Mobile Application Engineer |
| Senior Mobile QA Engineer (IoT, PaaS) |
| IoT Android Engineer |
| Senior Android Developer - IoT |
Test Engineer Positions
| IOT Test Engineer with QXDM |
| LTE IOT Test Engineer |
| Senior SW Test Engineer-IoT |
| Sr Test Engineer III (IOT) |
Technical Support Positions
| Technical Support Representative, IoT |
| Technician IoT Devices Support |
| IoT Application Support Engineer |
Intern Positions
| Intern Intern/ Co-op- M2M/ IoT Security |
| IOT Software Developer Intern - (IOTG Intern) |
| SSG - Graduate Intern (IoT and UPM Support) |
| IoT Product Marketing Intern |
| IOT Intern |
| IOT Software Developer Intern - (IOTG Intern) |
Other Interesting Positions
| Transition Planner IOT (C) |
| IoT Certication Manager |
| IoT Competitive Specialist (IOTG) |
Follow us @IoTCtrl | Join our Community
Guest blog post by Mike Davie.
With the exponential growth of IoT and M2M, data is seeping out of every nook and cranny of our corporate and personal lives. However, harnessing data and turning it into a valuable asset is still in its infancy stage of development. In a recent study, IDC estimates that only 5% of data created is actually analyzed. Thankfully, this is set to change as companies now have found lucrative revenue streams by converting their data into products.
Impediments to Data Monetization
Many companies are unaware of the value of their data, the type of customers who might potentially be interested in those data, and how to go about monetizing the data. To further complicate matters, many also are concerned that the data they possess, if sold, could reveal trade secrets and personalized information of their customers, thus violating personal data protection laws.
Dashboards and Applications
The most common approach for companies who have embarked on data monetization is to develop a dashboard or application for the data, thinking that it would give them greater control over the data. However, there are several downsides to this approach:
- Limited customer base
- The dashboard or application is developed with only one type of customer in mind, thus limiting the potential of the underlying data to reach a wider customer base.
- Data is non-extractable
- The data in a dashboard or application cannot be extracted to be mashed up with other data, with which valuable insights and analytics can be developed.
- Long lead time and high cost to develop
- Average development time for a dashboard or application is 18 months. Expensive resources including those of data scientists and developers are required.
Data as a Product
What many companies have failed to realize is that the raw data they possess could be cleansed, sliced and diced to meet the needs of data buyers. Aggregated and anonymized data products have a number of advantages over dashboards and applications.
- Short lead time and less cost to develop
- The process of cleaning and slicing data into bite size data products could be done in a 2-3 month time frame without the involvement of data scientists.
- Wide customer base
- Many companies and organizations could be interested in your data product. For example, real time footfall data from a telco could be used in a number of ways:
- A retailer could use mall foot traffic to determine the best time of the day to launch a new promotion to drive additional sales during off-peak hours.
- A logistics provider could be combining footfall data with operating expenses to determine the best location for a new distribution centre.
- A maintenance company could be using footfall to determine where to allocate cleaners to maximize efficiency, while ensuring clean facilities.
- Many companies and organizations could be interested in your data product. For example, real time footfall data from a telco could be used in a number of ways:
- Data is extractable
- Data in its original form could be meshed and blended with other data sources to provide unique competitive advantages. For example:
- An airline could blend real time weather forecast data with customer profile data to launch a promotion package prior to severe bad weather for those looking to escape for the weekend.
- Real time ship positioning data could be blended with a port’s equipment operation data to minimize downtime of the equipment and increase overall efficiency of the port.
- Data in its original form could be meshed and blended with other data sources to provide unique competitive advantages. For example:
Monetizing your data does not have to a painful and drawn out undertaking if you view data itself as the product. By taking your data product to market, data itself can become one of your company’s most lucrative and profitable revenue streams. By developing a data monetization plan now, you can reap the rewards of the new Data Economy.
About the Author:
Mike Davie has been leading the commercialization of disruptive mobile technology and ICT infrastructure for a decade with leading global technology firms in Asia, Middle East and North America.
He parlayed his vision and knowledge of evolution of ICT into the creation of DataStreamX, the world's first online marketplace for real time data. DataStreamX’s powerful platform enables data sellers to stream their data to global buyers across various industries in real time, multiplying their data revenue without having to invest in costly infrastructure and sales teams. DataStreamX's online platform provides a plethora of real time data to data hungry buyers at the click of their fingertips, enabling them to broaden and deepen their understanding of the industry they compete in, and to device effective strategies to out-manoeuvre their competitors.
Prior to founding DataStreamX, Mike was a member of the Advanced Mobile Product Strategy Division at Samsung where he developed go-to-market strategies for cutting edge technologies created in the Samsung R&D Labs. He also provided guidance to Asia and Middle East telcos on their 4G/LTE infrastructure data needs and worked closely with them to monetize their M2M and telco analytics data.
Mike has spoken at ICT and Big Data conferences including 4G World, LTE Asia, Infocomm Development of Singapore's IdeaLabs Sessions. Topics of his talks include Monetization of Data Assets, Data-as-a-Service, the Dichotomy of Real-time vs. Static Data.
Originally posted on Data Science Central
Follow us @IoTCtrl | Join our Community
Guest blog past by Rohit Yadav, from BRIDGEi2i Analytics Solution
The Net (Part 1)
The plot goes something like this – Sandra Bullock plays a computer expert Angela Benett, her life changes when she is sent a program with a crazy glitch to ‘de-bug’. Soon she finds out some vital government information on the disk, things gets nutty as fruitcake, her life becomes a nightmare with her records getting erased and she is given a new identity of some chick with a criminal record. That was 1995 and now it’s the end of 2013, imagine if something like this was possible back then, what can be done now.
Today, each one of us has so much personal digital data flowing out there that it is possible for someone to steal an entire online identity and cause real damage offline.
You already know that your personal information and references to your social media presence on Facebook, LinkedIn, Twitter, Instagram, Flickr etc. are all over google. This is the data that you know about and it is just a fraction of what can be unearthed with a little drilling, what is really scary is the data that you don’t know is constantly being collected, like your location data. Multiple apps collect location data and track your movements 24x7. Apart from your mobile phone if you use a smart card to pay road-toll or access public transport, you can be tracked by that as well. Some companies are taking this to the next level by using location data to confirm that employees not in the office are actually where they claim they are.
On the financial front, every time you swipe a credit or debit card you release more digital information. A marketer may analyse credit card purchases and deduce likely interests. Online retail giants like Amazon, Ebay uses such deduction algorithm when it offers hints like ‘people who viewed this product also looked at the following products. Indian players like Myntra and Flipkart use similar analyses. Recommender systems can help people to find interesting things. Amazon’s recommendation system has helped the technology giant to reap billions in sales increase, NETFLIX is another such success story.
Put all these bits and pieces together with just a little online snooping and you could create a detailed composite of an individual’s identity. This may sound like a crime fiction but the basis for it is visible everywhere, if you know where to look. Maybe it’s high time you give a thought to the question – “how public is your private life.”
THE NET- UNVEILED (Part 2)
On the hind side there is something called ‘Wearables’, a technology which aims to make life easier. With wearable technology, learning more about yourself has not only become high tech but also real time. From devices and apps that help you track heart rate and food consumption details to gadget that monitor your mood and even surrounding air.
I believe there are major four ways wearables can help improve our life:-
- Firstly wearables keep us FIT – a bracelet which tracks your activity levels, your nutrient intake and improve your fitness. NIKE-Fuelband is one such initiative.
- Secondly wearables save life – there are wearables which are not only crucial to your health but can also save lives. A wearable health monitor and GPS location device keeps track of the elderly and can alert their caregivers when something is wrong.
- Thirdly wearables keep us safer – an average smartphone user checks their phone 34 times a day. With people constantly looking at their devices on the go, things can get dangerous. This is where Google Glass comes into play, which is the beginning of this challenge.
- Fourthly wearables make things fun – apart from making things easier and improving our health, these devices can make life more interesting and fun.
Today the biggest market in wearable technology is health and fitness. Big companies are putting wearables to work to figure out how to use these kinds of gadget to improve their business. They are giving wearables to employees and customers to gather subtle data about how they move and act and then use that information to help them do their jobs better or improve their buying experience. However there is a big risk involved. People will naturally resist real world intrusion into their privacy, so businesses needs to be very careful about asking employees and customers to strap gadgets on their head, chest, wrists etc. This compels me to think that we need to truly evaluate the real need of wearable technology. Much of what is being done with wearable devices is happening simply because it can be done. However, several users still are not sure about wearables and whether they want to walk around with devices strapped to them all day. Is this the paradox of wearables?
Having said all this, I see a silver lining, with wearables every individual becomes a data generator and transmitter. We generate data that is continuously collected by various government agencies and private companies. This data can be monetised and can also be used to make life easier for the people, what we need to make sure is that the data do not get manipulated or misused because no one would want to be in Angela Benett’s shoes.
Rohit Yadav
Follow us @IoTCtrl | Join our Community