Join IoT Central | Join our LinkedIn Group | Post on IoT Central


predictive maintenance (5)

An AI based approach increases accuracy and can even make the impossible possible.
 
What is an Outlier?
 
Put simply, an outlier is a piece of data or observation that differs drastically from a given norm.
 
In the image above, the red fish is an outlier. Clearly differing by color, but also by size, shape, and more obviously direction. As such, the analysis of detecting outliers in data fall into two categories: univariate, and multivariate
  • Univariate: considering a single variable
  • Multivariate: considering multiple variables
 
Outlier Detection in Industrial IoT
 
In Industrial IoT use cases, outlier detection can be instrumental in specific use cases such as understanding the health of your machine. Instead of looking at characteristics of a fish like above, we are looking at characteristics of a machine via data such as sensor readings.
 
The goal is to learn what normal operation looks like where outliers are abnormal activity indicative of a future problem.
 
Statistical Approach to Outlier Detection
Statistics - Normal Distribution 
Statistical/probability based approaches date back centuries. You may recall back the bell curve. The values of your dataset plot to a distribution. In simplest terms, you calculate the mean and standard deviation of that distribution. You then can plot the location of x standard deviations from the mean and anything that falls beyond that is an outlier.
 
A simple example to explore using this approach is outside air temperature. Looking at the low temperature in Boston for the month of January from 2008-2018 we find an average temperature of ~23 degrees F with a standard deviation of ~9.62 degrees. Plotting out 2 standard deviations results in the following.
 
 
 a797d2_2861843bb7ba4a82bab87eef54b09196~mv2.png
 
 
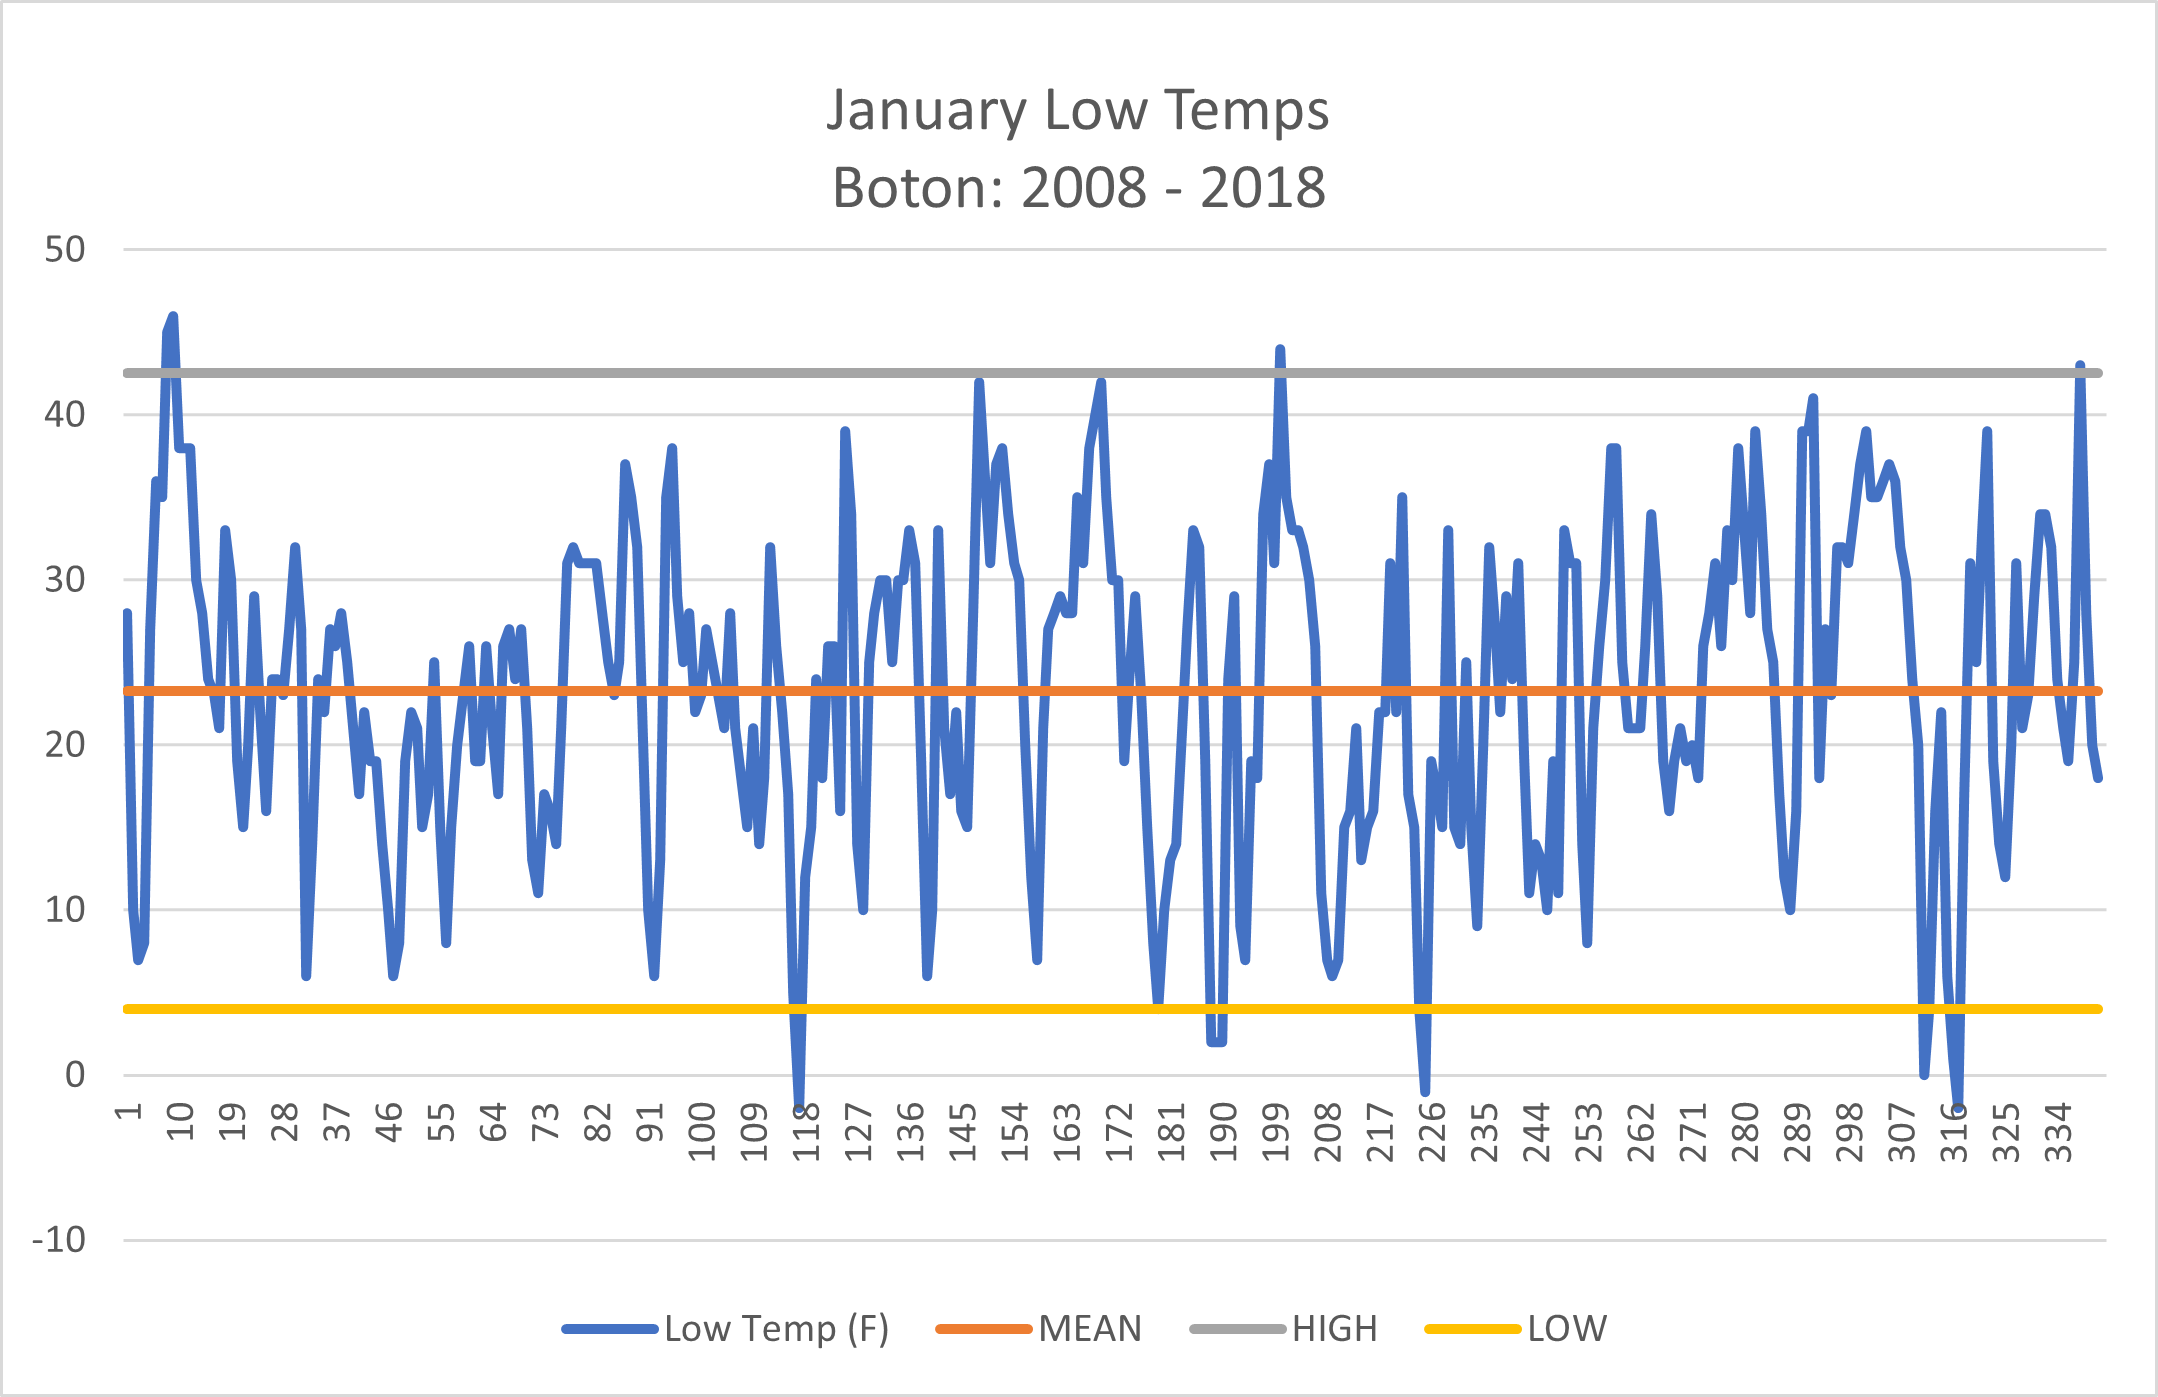
Interpreting the chart above, any temperature above the gray line or below the yellow can be considered outside the range of normal...or an outlier.
 
Why do we need AI?
If we just showed that you can determine outliers using simple statistics, then why do we need AI at all? The answer depends on the type of outlier analysis.
 
Why AI for Univariate Analysis?
In the example above, we successfully analyzed outliers in weather looking at a single variable: temperature.
 
So, why should we complicate things by introducing AI to the equation? The answer has to do with the distribution of your data. You can run univariate analysis using statistical measures, but in order for the results to be accurate, it is assumed that the distribution of your data is "normal". In other words, it needs to fit to the shape of a bell curve (like the left image below).
 
However, in the real world, and specifically in industrial use cases, the resulting sensor data is not perfectly normal (like the right image below).
 6 ways to test for a Normal Distribution — which one to use? | by Joos  Korstanje | Towards Data Science
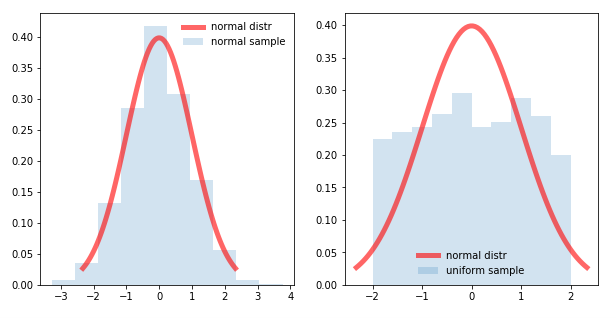
As a result, statistical analysis on a non-normal dataset would result in more false positives and false negatives.
 
The Need for AI
AI-based methods on the other hand, do not require a normal distribution and finds patterns in the data that result in much higher accuracy. In the case of the weather in Boston, getting the forecast slightly wrong does not have a huge impact. However, in industries such as rail, oil and gas, and industrial equipment, trust in the accuracy of your results has a long lasting impact. An impact that can only be achieved by AI.
 
Why AI for Multivariate Analysis?
The case for AI in a multivariate analysis is a bit more straight forward. Effectively, when we are looking at a single variable we can easily plot the results on a plane such as the temperature chart or the normal and non-normal distribution charts above.
 
However, if we are analyzing multiple points, such as the current, voltage and wattage of a motor, or vibration over 3 axis, or the return temp and discharge temp of an HVAC system, plotting and analyzing with statistics has its limitations. Just visualizing the plot becomes impossible for a human as we go from a single plane to hyperplanes as shown below.
 
MSRI | Hyperplane arrangements and application
 
The Need for AI
For multivariate analysis, visual inspection starts to go beyond human capabilities while technical analysis goes beyond statistical capabilities. Instead, AI can be utilized to find patterns in the underlying data in order to learn normal operation and adequately monitor for outliers. In other words, for multivariate analysis AI starts to make the impossible possible.
 
Summary
Statistics and probability has been around far longer than anyone reading this post. However, not all data is created equal and in the world of industrial IoT, statistical techniques have crucial limitations.
 
AI-based techniques go beyond these limitations helping to reduce false positives/negatives and often times making robust analysis possible for the first time.
 
At Elipsa, we build simple, fast and flexible AI for IoT. Get free access to our Community Edition to start integrating machine learning into your applications.
 
Read more…
Wouldn’t it be amazing to gain superpower like knowing every operational detail for enhanced efficiency? IoT helps with that too. Now it's all about interconnectivity, visibility, machine to machine communication. So, its clear IoT for the Real Estate Industry is here and is here to stay!
Read more…

Top 5 Industrial IoT use cases

The industrial IoT has already proven its versatility with deployments going live in a number of enterprises, showing off dozens of different use cases. But a few key uses consistently present themselves within the same trade, and even throughout different industries.

Top 5 industrial IoT use cases

It’s important to note that IoT use cases will likely expand in the next few years. That being said, we have compiled the top five industrial IoT use cases of today:

Predictive maintenance

Keeping assets up and running has the potential to significantly decreasing operational expenditures (opex), and save companies millions of dollars. With the use of sensors, cameras and data analytics, managers in a range of industries are able to determine when a piece of equipment will fail before it ever does. These IoT-enabled systems can sense signs of warning, use data to create a maintenance timeline and preemptively service equipment before problems occur.

By leveraging streaming data from sensors and devices to quickly assess current conditions, recognize warning signs, deliver alerts and automatically trigger appropriate maintenance processes, IoT turns maintenance into a dynamic, rapid and automated task.

This approach promises cost savings over routine or time-based preventive maintenance, because tasks are performed only when they are needed. The key is to get the right information in the right time. This will allow managers to know which equipment needs maintenance, maintenance work can be better planned and systems remain online while workers stay on task. Other potential advantages include increased equipment lifetime, increased plant safety and fewer accidents with negative impact on environment.

Smart metering

A smart meter is an internet-capable device that measures energy, water or natural gas consumption of a building or home, according to Silicon Labs.

Traditional meters only measure total consumption, whereas smart meters record when and how much of a resource is consumed. Power companies are deploying smart meters to monitor consumer usage and adjust prices according to the time of day and season.

Smart metering benefits utilities by improving customer satisfaction with faster interaction, giving consumers more control of their energy usage to save money and reduce carbon emissions. Smart meters also give visibility of power consumption all the way to the meter so utilities can optimize energy distribution and take action to shift demand loads.

According to Sierra Wireless, smart metering helps utilities to:

  • Reduce operating expenses by managing manual operations remotely
  • Improve forecasting and streamline power-consumption
  • Improve customer service through profiling and segmentation
  • Reduce energy theft
  • Simplify micro-generation monitoring and track renewable power

Asset tracking

A study on the maturity of asset efficiency practices from Infosys and the Institute for Industrial Management (FIR) at Aachen University revealed that 85% of manufacturing companies globally are aware of asset efficiency, but only 15% of the surveyed firms have implemented it at a systematic level.

source: Actsoft
source: Actsoft

Infosys and other supporting companies including Bosch, GE, IBM, Intel, National Instruments and PTC have launched a testbed with the main goal of collecting asset information efficiently and accurately in real-time and running analytics to allow the firms to make the best decisions.

The goal of asset tracking is to allow an enterprise to easily locate and monitor key assets (e.g. raw materials, final products, and containers) and to optimize logistics, maintain inventory levels, prevent quality issues and detect theft.

One industry that heavily relies on asset tracking is maritime shipping. On a large scale, sensors help track the location of a ship at sea, and on a smaller scale they are able to provide the status and temperature of individual cargo containers. One benefit is real-time metrics on refrigerated containers. These containers must be stored at constant temperatures so that perishable goods remain fresh.

Each refrigerated container needs to be equipped with temperature sensors, a processing unit and a mobile transmitter.

To continue reading, please visit the full article on Industrial IoT & 5G


Read more…

A smart, highly optimized distributed neural network, based on Intel Edison "Receptive" Nodes

Training ‘complex multi-layer’ neural networks is referred to as deep-learning as these multi-layer neural architectures interpose many neural processing layers between the input data and the predicted output results – hence the use of the word deep in the deep-learning catchphrase.

While the training procedure of large scale network is computationally expensive, evaluating the resulting trained neural network is not, which explains why trained networks can be extremely valuable as they have the ability to very quickly perform complex, real-world pattern recognition tasks on a variety of low-power devices.

These trained networks can perform complex pattern recognition tasks for real-world applications ranging from real-time anomaly detection in Industrial IoT to energy performance optimization in complex industrial systems. The high-value, high accuracy recognition (sometimes better than human) trained models have the ability to be deployed nearly everywhere, which explains the recent resurgence in machine-learning, in particular in deep-learning neural networks.

These architectures can be efficiently implemented on Intel Edison modules to process information quickly and economically, especially in Industrial IoT application.

Our architectural model is based on a proprietary algorithm, called Hierarchical LSTM, able to capture and learn the internal dynamics of physical systems, simply observing the evolution of related time series.

To train efficiently the system, we implemented a greedy, layer based parameter optimization approach, so each device can train one layer at a time, and send the encoded feature to the upper level device, to learn higher levels of abstraction on signal dinamic.

Using Intel Edison as layers "core computing units", we can perform higher sampling rates and frequent retraining, near the system we are observing without the need of a complex cloud architecture, sending just a small amount of encoded data to the cloud.

Read more…

Sponsor